Technical Analysis of GFR 2024-05-10
Overview:
In analyzing the technical indicators for GFR stock over the last 5 days, we will delve into the trends, momentum, volatility, and volume aspects to provide a comprehensive outlook on the possible stock price movement in the coming days.
Trend Analysis:
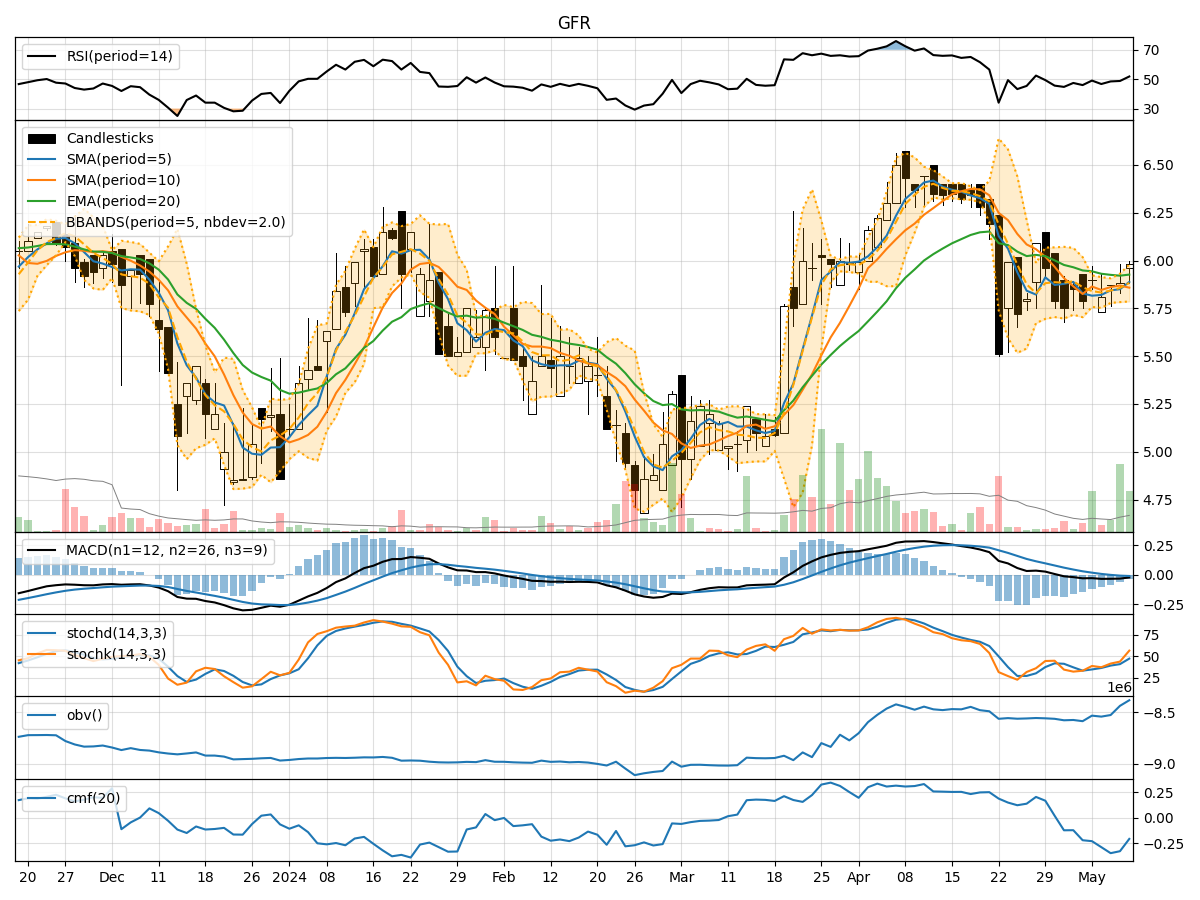
- Moving Averages (MA): The 5-day Moving Average (MA) has been fluctuating around the closing prices, indicating short-term price trends. The Simple Moving Average (SMA) and Exponential Moving Average (EMA) show a slight downward trend.
- MACD: The Moving Average Convergence Divergence (MACD) has been negative, suggesting a bearish momentum in the stock price.
- MACD Histogram: The MACD Histogram has been decreasing, indicating a weakening bearish momentum.
Momentum Analysis:
- RSI: The Relative Strength Index (RSI) has been hovering around the neutral zone, indicating a lack of strong buying or selling pressure.
- Stochastic Oscillator: Both %K and %D lines of the Stochastic Oscillator have been rising, suggesting a potential bullish momentum.
- Williams %R: The Williams %R is in the oversold region, indicating a possible reversal in the stock price.
Volatility Analysis:
- Bollinger Bands (BB): The Bollinger Bands have been widening, indicating increased volatility in the stock price.
- Bollinger %B: The %B indicator is below 1, suggesting that the stock price is trading below the lower Bollinger Band, potentially indicating an oversold condition.
Volume Analysis:
- On-Balance Volume (OBV): The OBV has been fluctuating, indicating mixed buying and selling pressure.
- Chaikin Money Flow (CMF): The CMF has been negative, suggesting a bearish money flow in the stock.
Key Observations and Opinions:
- Trend: The trend indicators show a slightly bearish sentiment in the short term.
- Momentum: The momentum indicators are mixed, with a potential bullish signal from the Stochastic Oscillator.
- Volatility: Increased volatility can lead to sharp price movements in either direction.
- Volume: The volume indicators suggest a lack of strong buying interest.
Conclusion:
Based on the analysis of the technical indicators, the stock of GFR is currently exhibiting a mixed outlook. While the trend and momentum indicators lean slightly towards a bearish sentiment, the Stochastic Oscillator hints at a potential bullish momentum. The increased volatility and lack of strong volume support further add to the uncertainty.
Recommendation:
Considering the mixed signals from the technical indicators, it is advisable for investors to exercise caution and closely monitor the stock price movement in the coming days. It would be prudent to wait for more clarity in the market dynamics before making any significant trading decisions.