Technical Analysis of GD 2024-05-10
Overview:
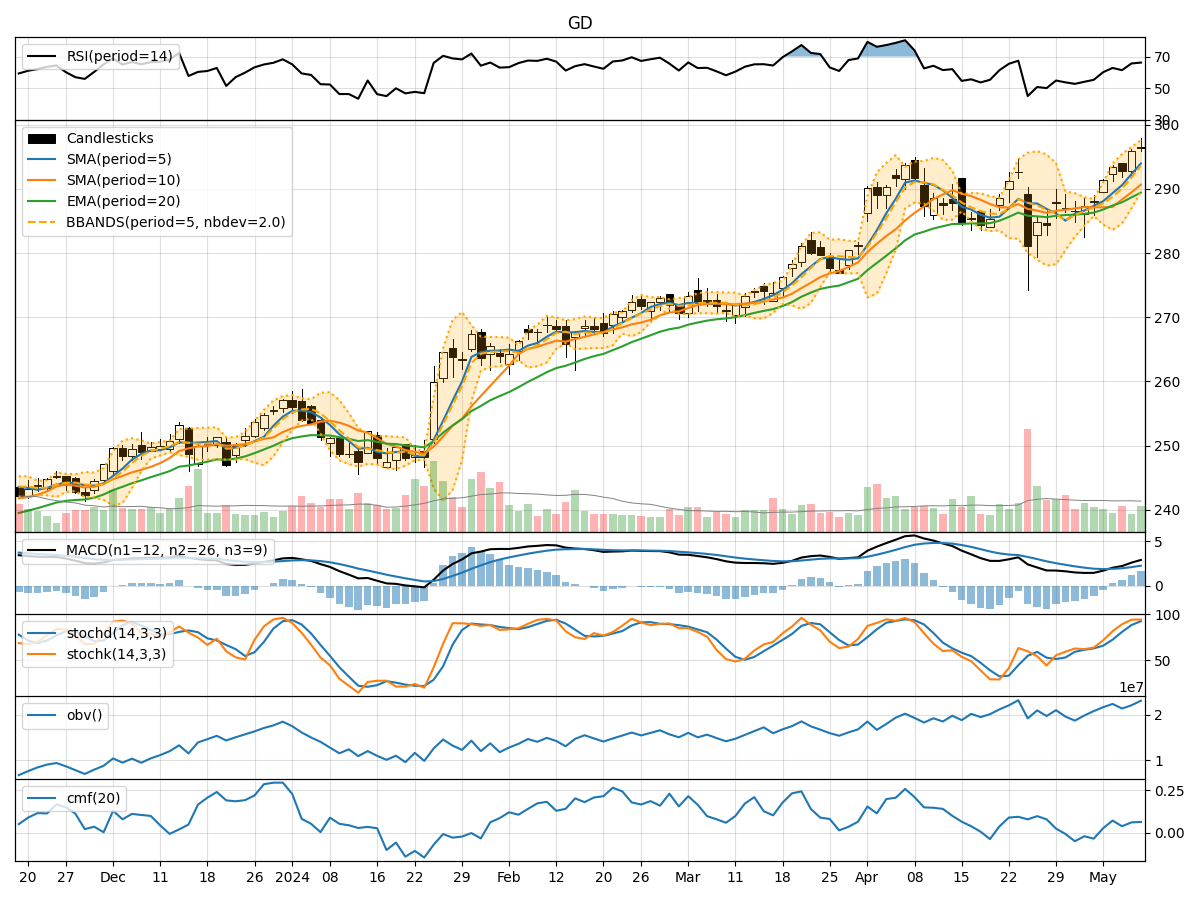
In analyzing the technical indicators for GD over the last 5 days, we will delve into the trends, momentum, volatility, and volume aspects to provide a comprehensive outlook on the possible stock price movement in the coming days.
Trend Analysis:
- Moving Averages (MA): The 5-day MA has been consistently rising, indicating a bullish trend.
- MACD: The MACD line has been above the signal line, suggesting a bullish momentum.
- RSI: The RSI has been in the overbought territory, indicating a strong bullish sentiment.
Momentum Analysis:
- Stochastic Oscillator: Both %K and %D have been in the overbought zone, signaling a potential reversal.
- Williams %R: The indicator has been in the oversold region, suggesting a possible upward movement.
Volatility Analysis:
- Bollinger Bands: The stock price has been trading near the upper band, indicating high volatility.
- Average True Range (ATR): The ATR value has been relatively high, reflecting increased price fluctuations.
Volume Analysis:
- On-Balance Volume (OBV): The OBV has been increasing, indicating accumulation by investors.
- Chaikin Money Flow (CMF): The CMF has been positive, suggesting buying pressure in the stock.
Key Observations:
- The technical indicators collectively point towards a bullish sentiment in the stock.
- The stock is currently in an uptrend with strong momentum and increasing buying pressure.
- Volatility is high, indicating potential price swings in the coming days.
- The volume indicators support the bullish outlook with increasing accumulation.
Conclusion:
Based on the analysis of the technical indicators, the next few days are likely to see a continuation of the bullish trend in GD stock. Traders and investors can consider buying opportunities, keeping a close watch on potential profit-taking levels. It is advisable to set stop-loss orders to manage risk in case of any unexpected reversals. Overall, the outlook for GD stock is upward with the potential for further price appreciation.