Technical Analysis of GATO 2024-05-10
Overview:
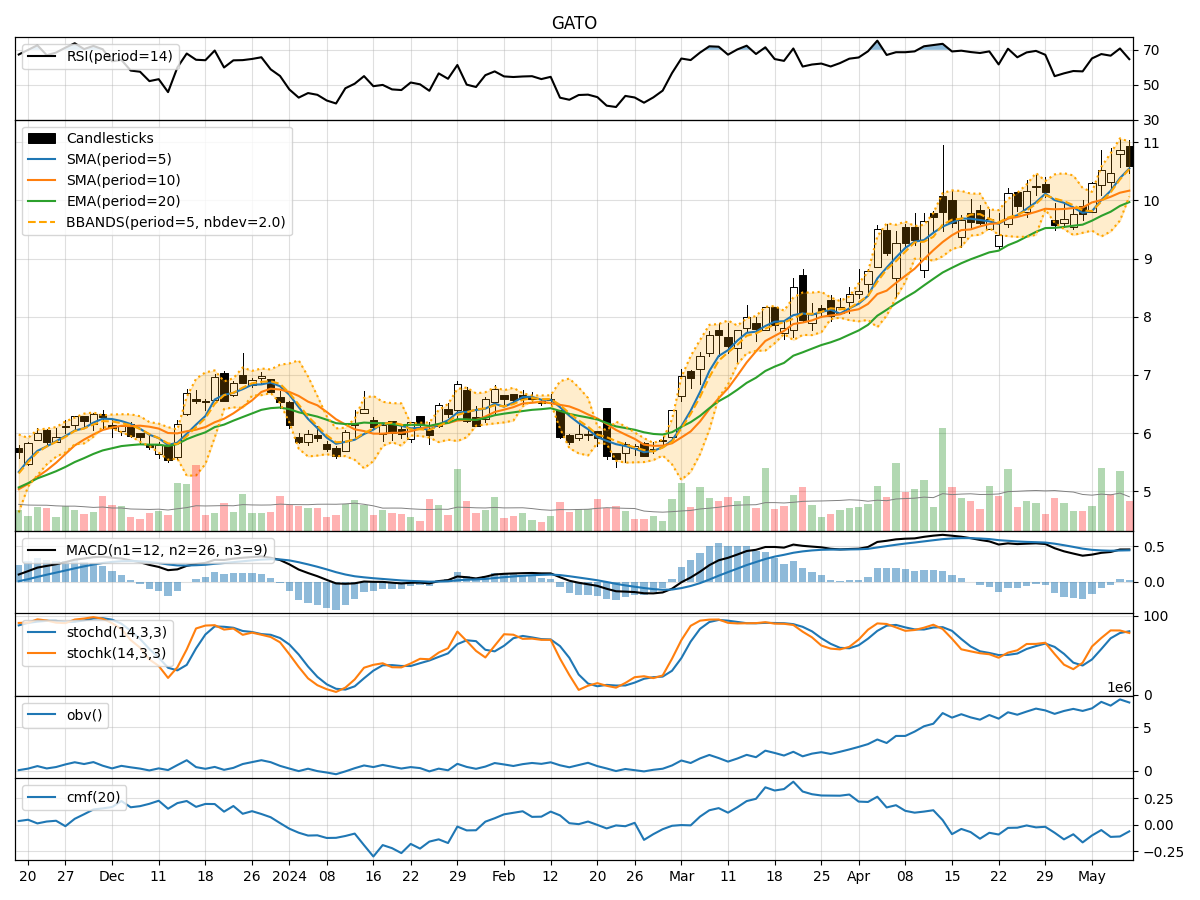
In analyzing the technical indicators for GATO over the last 5 days, we will delve into the trend, momentum, volatility, and volume indicators to provide a comprehensive outlook on the possible stock price movement in the coming days. By examining these key aspects, we aim to offer valuable insights and predictions for potential investors.
Trend Analysis:
- Moving Averages (MA): The 5-day Moving Average (MA) has been consistently above the Simple Moving Average (SMA) and Exponential Moving Average (EMA), indicating a bullish trend.
- MACD: The MACD line has been positive, with the MACD Histogram also showing positive values, suggesting upward momentum in the stock price.
Momentum Analysis:
- RSI: The Relative Strength Index (RSI) has been fluctuating around the overbought territory, indicating strong buying momentum.
- Stochastic Oscillator: Both %K and %D have been in the overbought zone, suggesting a potential reversal or consolidation phase.
- Williams %R: The Williams %R has been in the oversold region, indicating a possible buying opportunity.
Volatility Analysis:
- Bollinger Bands: The Bollinger Bands have been widening, indicating increased volatility in the stock price.
- Bollinger %B: The %B indicator has been fluctuating, suggesting potential price reversals or breakouts.
Volume Analysis:
- On-Balance Volume (OBV): The OBV has been fluctuating, indicating mixed buying and selling pressure.
- Chaikin Money Flow (CMF): The CMF has been negative, suggesting a lack of buying interest in the stock.
Key Observations:
- The trend indicators suggest a bullish sentiment in the stock price.
- Momentum indicators show mixed signals with potential for a reversal.
- Volatility indicators point towards increased price fluctuations.
- Volume indicators indicate a lack of strong buying interest in the stock.
Conclusion:
Based on the analysis of the technical indicators, the next few days' possible stock price movement for GATO could be sideways with a slight upward bias. While the trend indicators remain bullish, the mixed signals from momentum and volume indicators, along with increased volatility, suggest a potential consolidation phase or a minor correction before a possible continuation of the uptrend. Traders should closely monitor key support and resistance levels for potential entry and exit points.
Recommendation:
- Short-term Traders: Consider taking profits on existing positions and wait for clearer signals before entering new trades.
- Long-term Investors: Hold onto positions with a cautious approach, considering potential price fluctuations in the near term.
- Risk Management: Implement stop-loss orders to protect gains and manage downside risk effectively.
By staying vigilant and adapting to changing market conditions, investors can navigate potential price movements in GATO more effectively.