Technical Analysis of G 2024-05-10
Overview:
In analyzing the technical indicators for the stock over the last 5 days, we will delve into the trend, momentum, volatility, and volume indicators to provide a comprehensive outlook on the possible future stock price movement. By examining these key aspects, we aim to offer valuable insights and predictions for the upcoming trading days.
Trend Analysis:
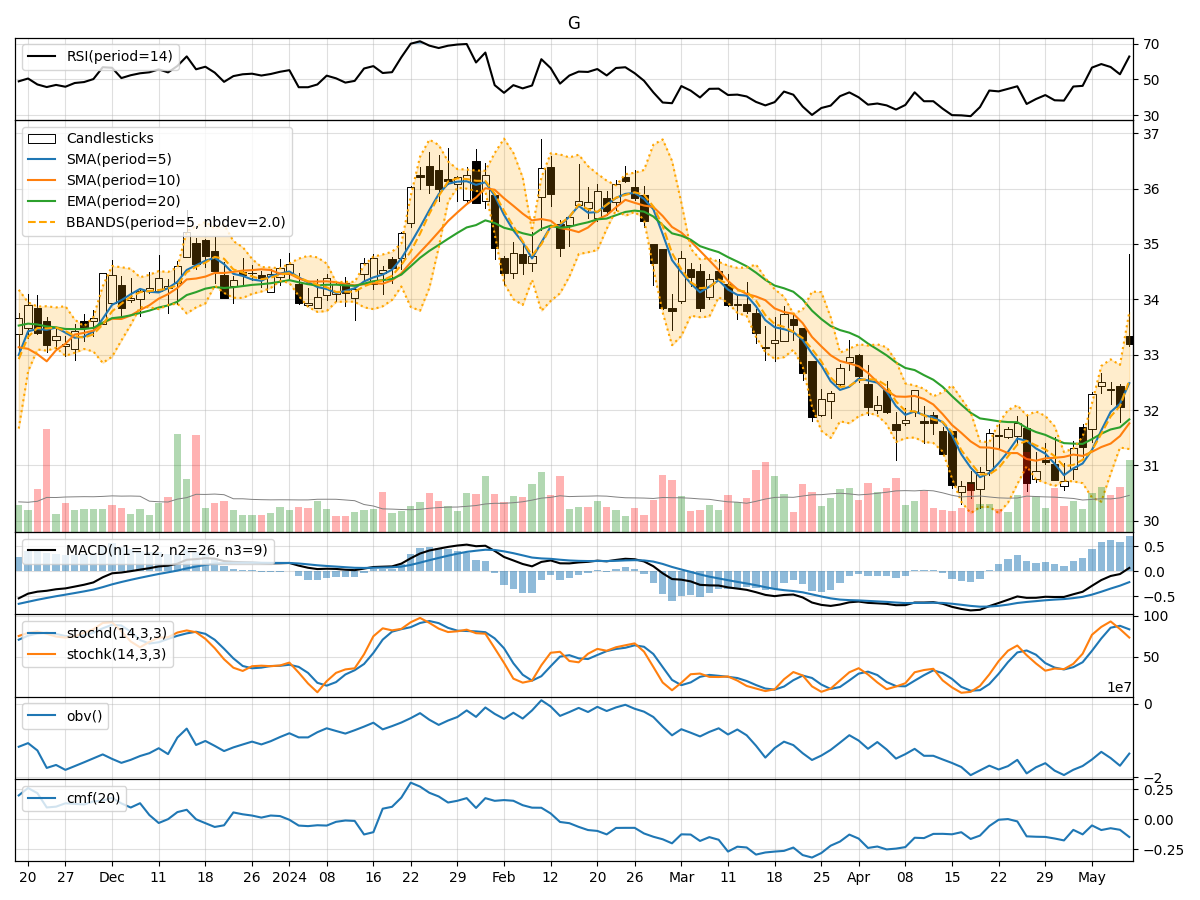
- Moving Averages (MA): The 5-day Moving Average (MA) has been steadily increasing, indicating a positive trend in the stock price.
- MACD: The Moving Average Convergence Divergence (MACD) has been consistently rising, with the MACD line above the signal line, suggesting bullish momentum.
- RSI: The Relative Strength Index (RSI) has been fluctuating but generally staying within the neutral range, indicating a balanced momentum.
Momentum Analysis:
- Stochastic Oscillator: The Stochastic Oscillator shows a downward trend, suggesting a potential reversal in momentum.
- Williams %R: The Williams %R indicator is in oversold territory, indicating a possible buying opportunity.
Volatility Analysis:
- Bollinger Bands: The Bollinger Bands have been narrowing, indicating decreasing volatility in the stock price.
- Average True Range (ATR): The ATR has been relatively stable, suggesting consistent price movements.
Volume Analysis:
- On-Balance Volume (OBV): The OBV indicator has been fluctuating, reflecting mixed buying and selling pressure.
- Chaikin Money Flow (CMF): The CMF has been negative, indicating outflow of money from the stock.
Key Observations:
- The stock has shown a positive trend based on moving averages and MACD.
- Momentum indicators suggest a potential reversal in the short term.
- Volatility has been decreasing, indicating a possible period of consolidation.
- Volume indicators reflect mixed sentiment among investors.
Conclusion:
Based on the analysis of the technical indicators, the stock is likely to experience sideways movement in the next few days. While the trend and momentum indicators point towards a potential continuation of the current positive trend, the momentum indicators suggest a short-term reversal. The decreasing volatility and mixed volume signals further support the view of consolidation. Therefore, investors should exercise caution and closely monitor the stock for any signs of a breakout or trend reversal.