Technical Analysis of FVRR 2024-05-10
Overview:
In analyzing the technical indicators for FVRR over the last 5 days, we will delve into the trend, momentum, volatility, and volume indicators to provide a comprehensive outlook on the possible stock price movement in the coming days. By examining these key aspects, we aim to offer valuable insights and predictions to guide your investment decisions.
Trend Analysis:
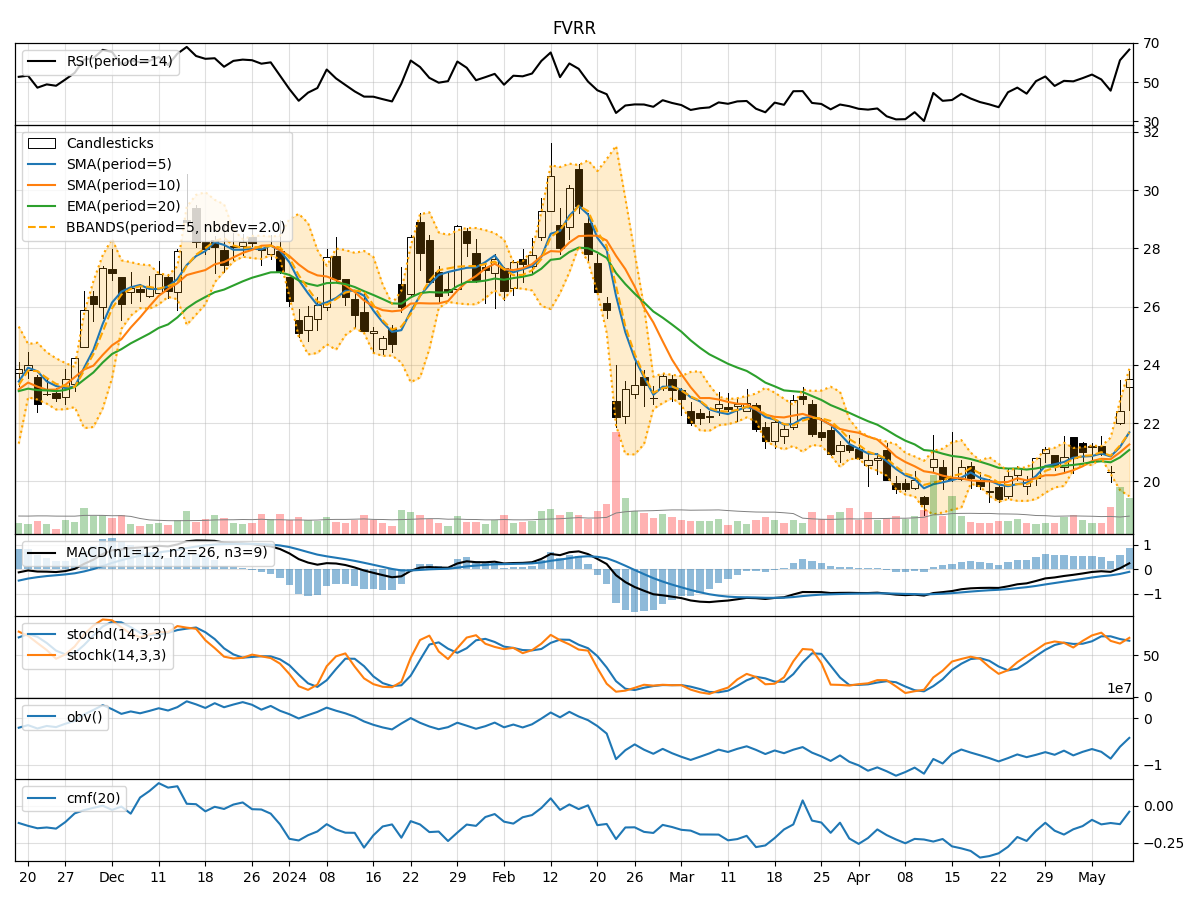
- Moving Averages (MA): The 5-day Moving Average (MA) has been showing an upward trend, indicating a positive momentum in the stock price.
- MACD: The Moving Average Convergence Divergence (MACD) has been consistently positive, suggesting bullish momentum in the stock.
- EMA: The Exponential Moving Average (EMA) has been trending upwards, supporting the bullish sentiment in the short to medium term.
Momentum Analysis:
- RSI: The Relative Strength Index (RSI) has been fluctuating but generally staying within the neutral range, indicating a balanced momentum.
- Stochastic Oscillator: The Stochastic Oscillator shows mixed signals, with some days indicating overbought conditions and others oversold.
- Williams %R: The Williams %R is also fluctuating, reflecting indecision in the market sentiment.
Volatility Analysis:
- Bollinger Bands: The Bollinger Bands are widening, suggesting increased volatility in the stock price.
- Volatility Indicators: The volatility indicators show a significant increase in price range, indicating higher fluctuations in the stock.
Volume Analysis:
- On-Balance Volume (OBV): The OBV has been fluctuating, indicating mixed buying and selling pressure.
- Chaikin Money Flow (CMF): The CMF has been negative, suggesting a slight distribution phase in the stock.
Key Observations:
- The trend indicators point towards a bullish sentiment in the stock, supported by positive moving averages and MACD.
- Momentum indicators show mixed signals, with RSI and Stochastic Oscillator indicating neutral to slightly bearish momentum.
- Volatility has increased significantly, indicating higher price fluctuations and potential trading opportunities.
- Volume indicators suggest mixed buying and selling pressure, with a slight distribution phase indicated by CMF.
Conclusion:
Based on the analysis of the technical indicators, the stock price of FVRR is likely to experience increased volatility in the coming days. While the trend indicators suggest a bullish bias, the mixed signals from momentum indicators and volume indicators indicate a potential consolidation phase or sideways movement in the short term. Traders should closely monitor key support and resistance levels for potential entry and exit points, considering the heightened volatility in the stock.