Technical Analysis of FTS 2024-05-10
Overview:
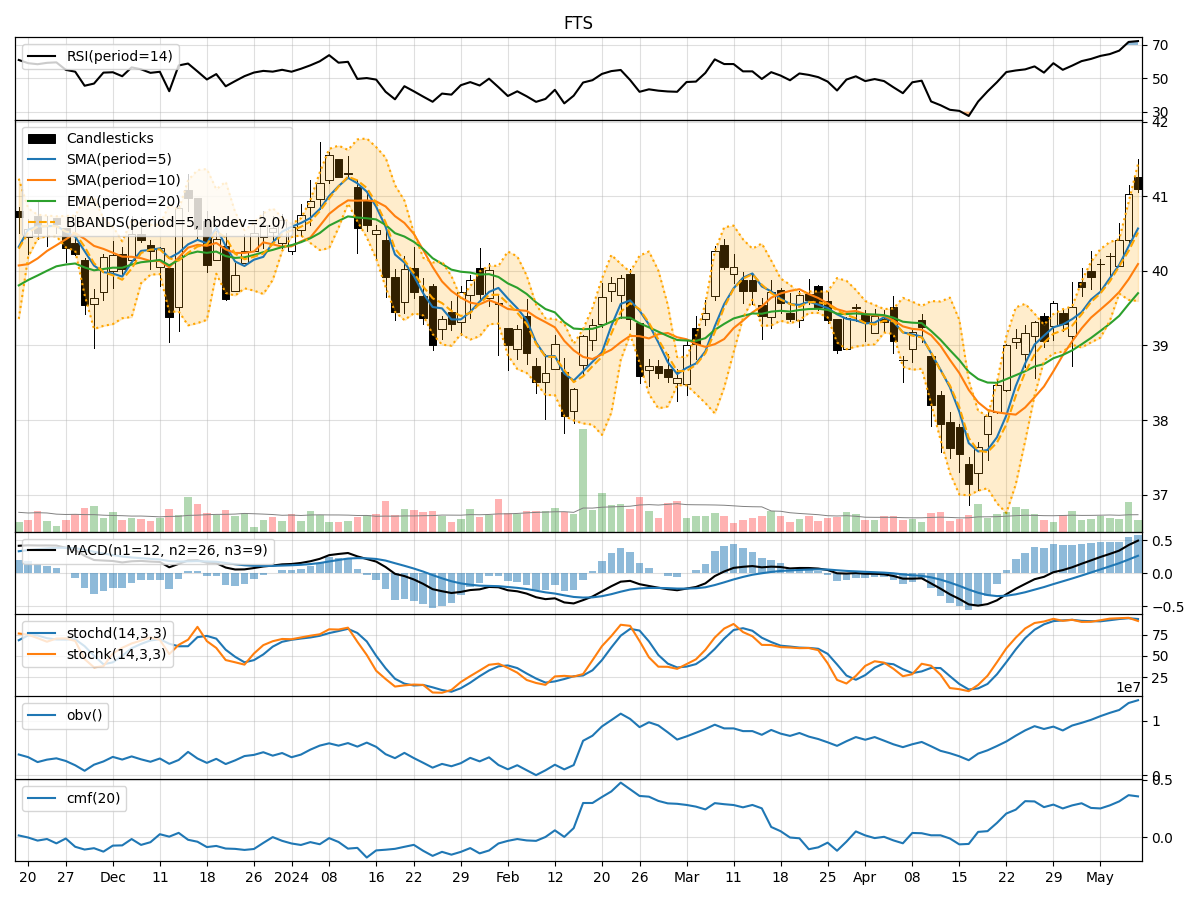
In analyzing the technical indicators for FTS over the last 5 days, we will delve into the trend, momentum, volatility, and volume indicators to provide a comprehensive outlook on the possible stock price movement in the coming days. By examining these key indicators, we aim to offer valuable insights and predictions for informed decision-making.
Trend Indicators:
- Moving Averages (MA): The 5-day moving average has been consistently rising, indicating a bullish trend in the short term.
- MACD: The MACD line has been increasing, crossing above the signal line, suggesting a bullish momentum.
- EMA: The exponential moving average has also been trending upwards, supporting the bullish sentiment.
Momentum Indicators:
- RSI: The Relative Strength Index has been in the overbought territory, indicating a strong bullish momentum.
- Stochastic Oscillator: Both %K and %D have been high, suggesting a strong upward momentum.
- Williams %R: The indicator has been in the oversold region, signaling a potential reversal to the upside.
Volatility Indicators:
- Bollinger Bands: The stock price has been trading near the upper Bollinger Band, indicating high volatility and a potential overbought condition.
- Bollinger %B: The %B indicator is above 0.8, suggesting a possible overbought situation.
Volume Indicators:
- On-Balance Volume (OBV): The OBV has been steadily increasing, reflecting strong buying pressure.
- Chaikin Money Flow (CMF): The CMF has been positive, indicating money flow into the stock.
Key Observations and Opinions:
- Trend: The trend indicators suggest a strong bullish sentiment in the short term.
- Momentum: Momentum indicators confirm the bullish momentum, but caution is advised as some indicators are in overbought territory.
- Volatility: High volatility near the upper Bollinger Band may indicate a potential pullback or consolidation.
- Volume: Increasing OBV and positive CMF indicate strong buying interest in the stock.
Conclusion:
Based on the analysis of the technical indicators, the next few days' possible stock price movement for FTS is likely to continue upwards in the short term. However, caution is advised due to the overbought conditions in some momentum indicators and high volatility near the upper Bollinger Band. Traders and investors should closely monitor the price action for any signs of a potential reversal or consolidation.