Technical Analysis of FSM 2024-05-10
Overview:
In analyzing the technical indicators for FSM over the last 5 days, we will delve into the trend, momentum, volatility, and volume indicators to provide a comprehensive outlook on the possible stock price movement in the coming days. By examining these key aspects, we aim to offer valuable insights and predictions to guide your investment decisions.
Trend Analysis:
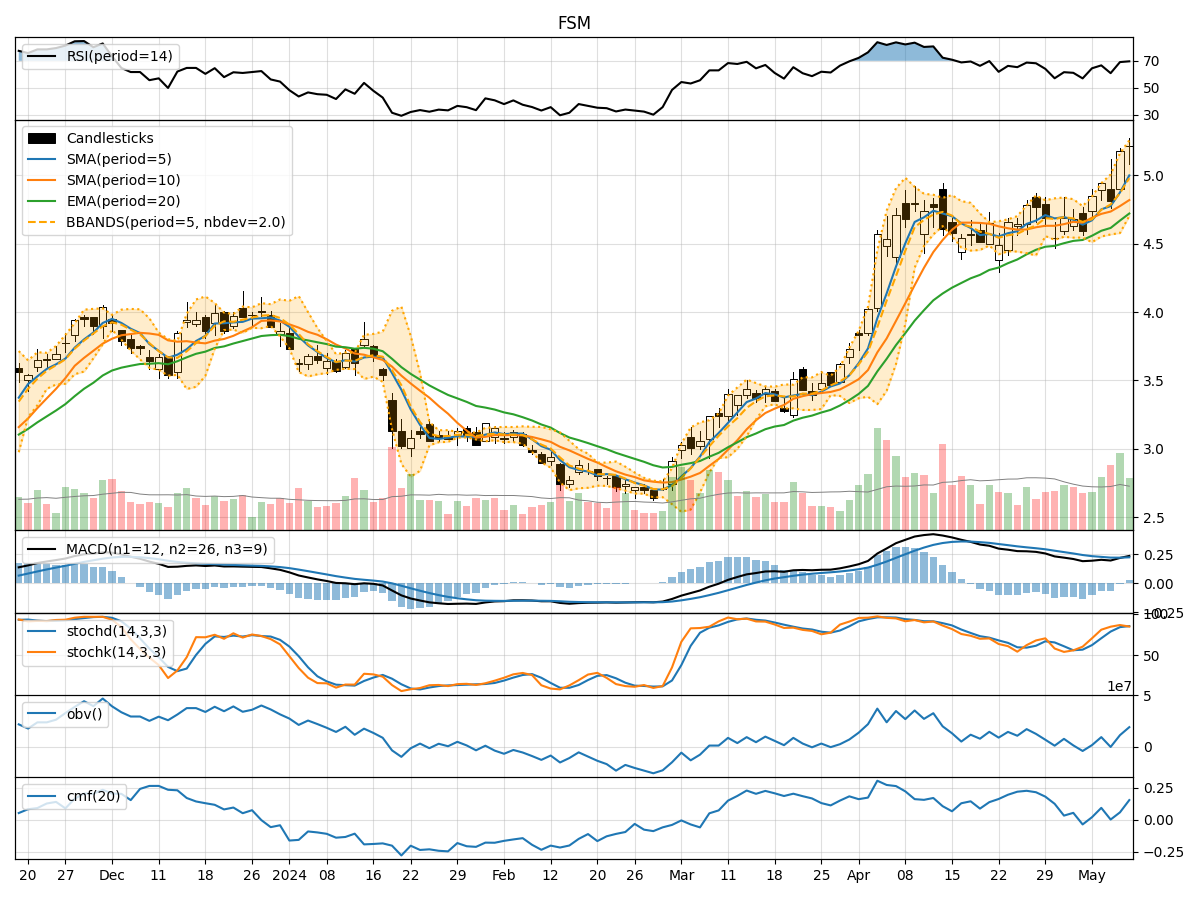
- Moving Averages (MA): The 5-day Moving Average (MA) has been consistently above the closing prices, indicating a bullish trend.
- MACD: The MACD line has been consistently above the signal line, suggesting a bullish momentum in the short term.
- EMA: The Exponential Moving Average has been trending upwards, supporting the bullish sentiment.
Momentum Analysis:
- RSI: The Relative Strength Index has been hovering in the overbought territory, indicating strong buying momentum.
- Stochastic Oscillator: Both %K and %D have been in the overbought zone, signaling a potential reversal.
- Williams %R: The indicator has been fluctuating in the oversold and overbought regions, suggesting mixed momentum.
Volatility Analysis:
- Bollinger Bands: The stock price has been trading above the upper Bollinger Band, indicating overbought conditions.
- Bollinger %B: The %B indicator has been above 0.8, signaling a potential reversal or correction.
Volume Analysis:
- On-Balance Volume (OBV): The OBV has been increasing, reflecting strong buying pressure.
- Chaikin Money Flow (CMF): The CMF has been positive, indicating money flow into the stock.
Conclusion:
Based on the analysis of the technical indicators, the stock of FSM is currently exhibiting overbought conditions with strong bullish momentum. However, the stochastic oscillator suggests a potential reversal in the short term. Considering the overbought status, high volatility, and mixed momentum signals, it is likely that the stock may experience a pullback or consolidation in the coming days. Traders should exercise caution and consider taking profits or implementing risk management strategies.