Technical Analysis of FMS 2024-05-10
Overview:
In analyzing the technical indicators for FMS over the last 5 days, we will delve into the trend, momentum, volatility, and volume indicators to provide a comprehensive outlook on the possible stock price movement in the coming days. By examining these key aspects, we aim to offer valuable insights and predictions for potential investors.
Trend Analysis:
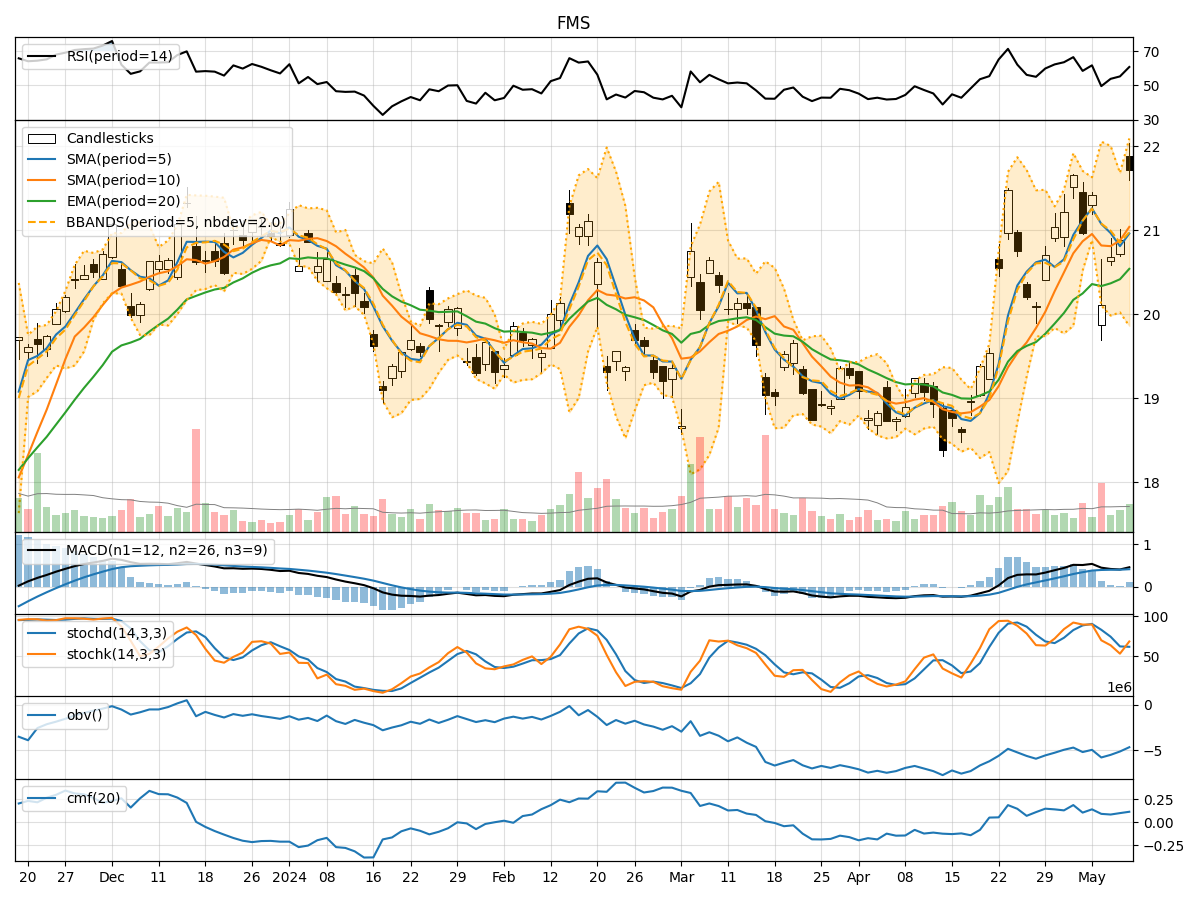
- Moving Averages (MA): The 5-day MA has been fluctuating around the closing prices, indicating short-term price trends. The SMA(10) and EMA(20) have shown slight variations but have not diverged significantly.
- MACD: The MACD line has been positive, indicating a bullish trend, with the MACD histogram showing a slight increase over the past few days.
Momentum Analysis:
- RSI: The RSI has been fluctuating within the neutral zone, suggesting a lack of strong momentum in either direction.
- Stochastic Oscillator: Both %K and %D have shown mixed signals, with %K crossing %D multiple times, indicating indecision in the market.
- Williams %R: The Williams %R has been oscillating between oversold and neutral levels, reflecting uncertainty among traders.
Volatility Analysis:
- Bollinger Bands (BB): The bands have been narrowing, indicating decreasing volatility in the stock price. The %B indicator has been hovering around the midline, suggesting a balanced market sentiment.
Volume Analysis:
- On-Balance Volume (OBV): The OBV has shown a slight decrease over the past few days, indicating some selling pressure.
- Chaikin Money Flow (CMF): The CMF has been positive but relatively flat, suggesting a balance between buying and selling pressure.
Key Observations:
- The trend indicators suggest a mild bullish sentiment, supported by the positive MACD.
- Momentum indicators show mixed signals, with no clear direction in the short term.
- Volatility has been decreasing, indicating a potential period of consolidation.
- Volume indicators point towards a slight increase in selling pressure.
Conclusion:
Based on the analysis of the technical indicators, the stock price of FMS is likely to experience sideways movement or consolidation in the next few days. The lack of strong momentum, coupled with decreasing volatility and mixed volume signals, suggests a period of indecision among market participants. Investors should exercise caution and closely monitor key levels for potential breakout or reversal signals before making any trading decisions.