Technical Analysis of FINV 2024-05-10
Overview:
In analyzing the technical indicators for FINV over the last 5 days, we will delve into the trend, momentum, volatility, and volume indicators to provide a comprehensive outlook on the possible stock price movement in the coming days. By examining these key aspects, we aim to offer valuable insights and predictions to guide your investment decisions.
Trend Analysis:
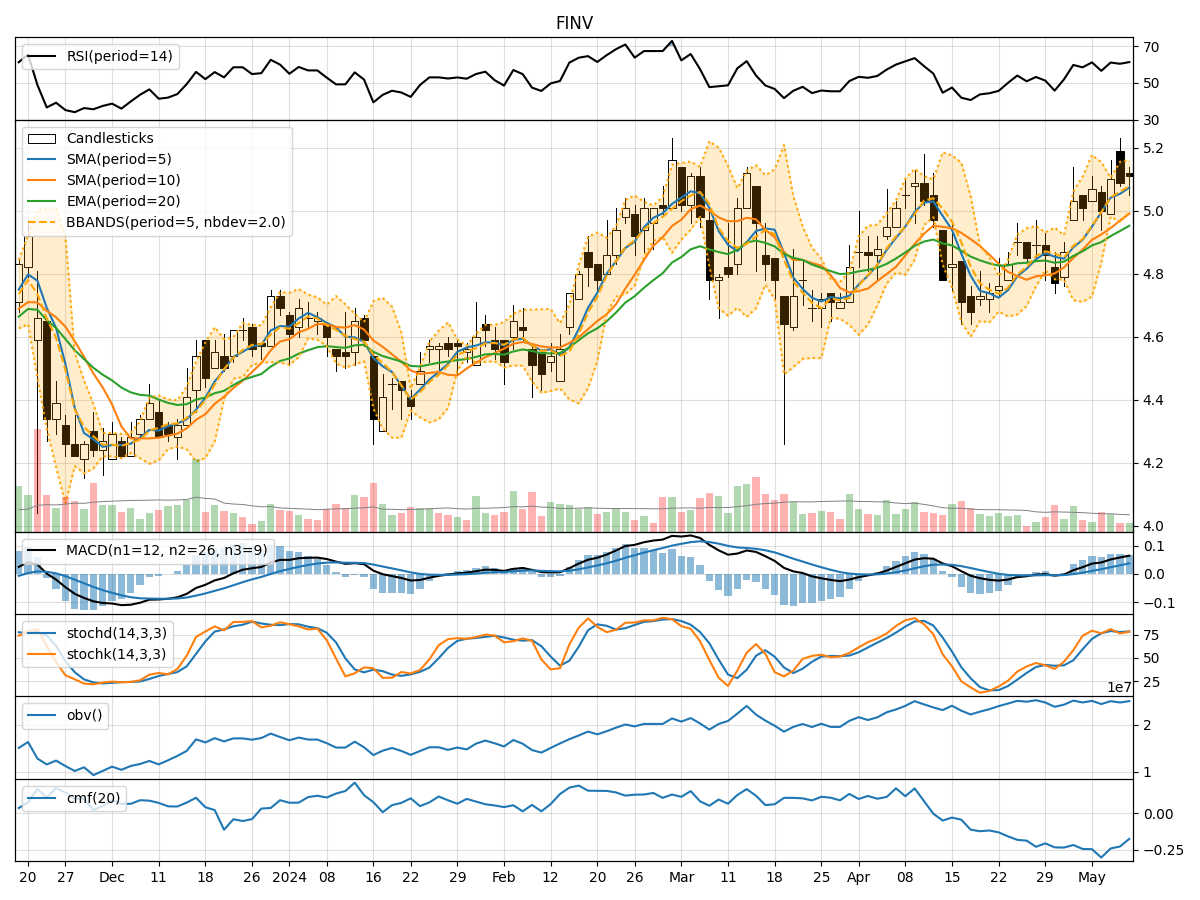
- Moving Averages (MA): The 5-day moving average (MA) has been steadily increasing, indicating a positive trend in the stock price.
- MACD: The MACD line has been consistently above the signal line, suggesting bullish momentum in the stock.
- EMA: The exponential moving average has also been trending upwards, supporting the bullish sentiment in the stock.
Momentum Analysis:
- RSI: The Relative Strength Index (RSI) has been hovering around the 60-70 range, indicating a neutral to slightly bullish momentum.
- Stochastic Oscillator: Both %K and %D have been in the overbought territory, signaling a potential reversal or consolidation.
- Williams %R: The Williams %R is showing oversold conditions, suggesting a possible buying opportunity.
Volatility Analysis:
- Bollinger Bands: The stock price has been trading within the Bollinger Bands, indicating normal volatility levels.
- Bollinger Band Width: The Band Width has been relatively stable, suggesting consistent volatility in the stock.
- Bollinger Band %B: The %B indicator is around 0.7-0.8, indicating the stock is trading closer to the upper band.
Volume Analysis:
- On-Balance Volume (OBV): The OBV has been fluctuating but overall showing a slight increase, reflecting mixed sentiment among investors.
- Chaikin Money Flow (CMF): The CMF has been negative, indicating selling pressure in the stock.
Key Observations:
- The trend indicators suggest a bullish sentiment in the stock, supported by the moving averages and MACD.
- Momentum indicators show a mixed picture with RSI neutral, Stochastic overbought, and Williams %R oversold.
- Volatility remains stable within the Bollinger Bands, indicating consistent price movements.
- Volume indicators reflect mixed sentiment, with OBV showing slight accumulation but CMF indicating selling pressure.
Conclusion:
Based on the analysis of the technical indicators, the stock is likely to experience a continuation of the bullish trend in the short term. However, caution is advised as momentum indicators suggest a potential reversal or consolidation. Volatility is expected to remain stable, providing trading opportunities within the current price range. Investors should closely monitor key support and resistance levels to make informed trading decisions.