Technical Analysis of FE 2024-05-10
Overview:
In analyzing the technical indicators for FE stock over the last 5 days, we will delve into the trend, momentum, volatility, and volume indicators to provide a comprehensive outlook on the possible stock price movement in the coming days. By examining these key indicators, we aim to offer valuable insights and predictions for potential investors.
Trend Analysis:
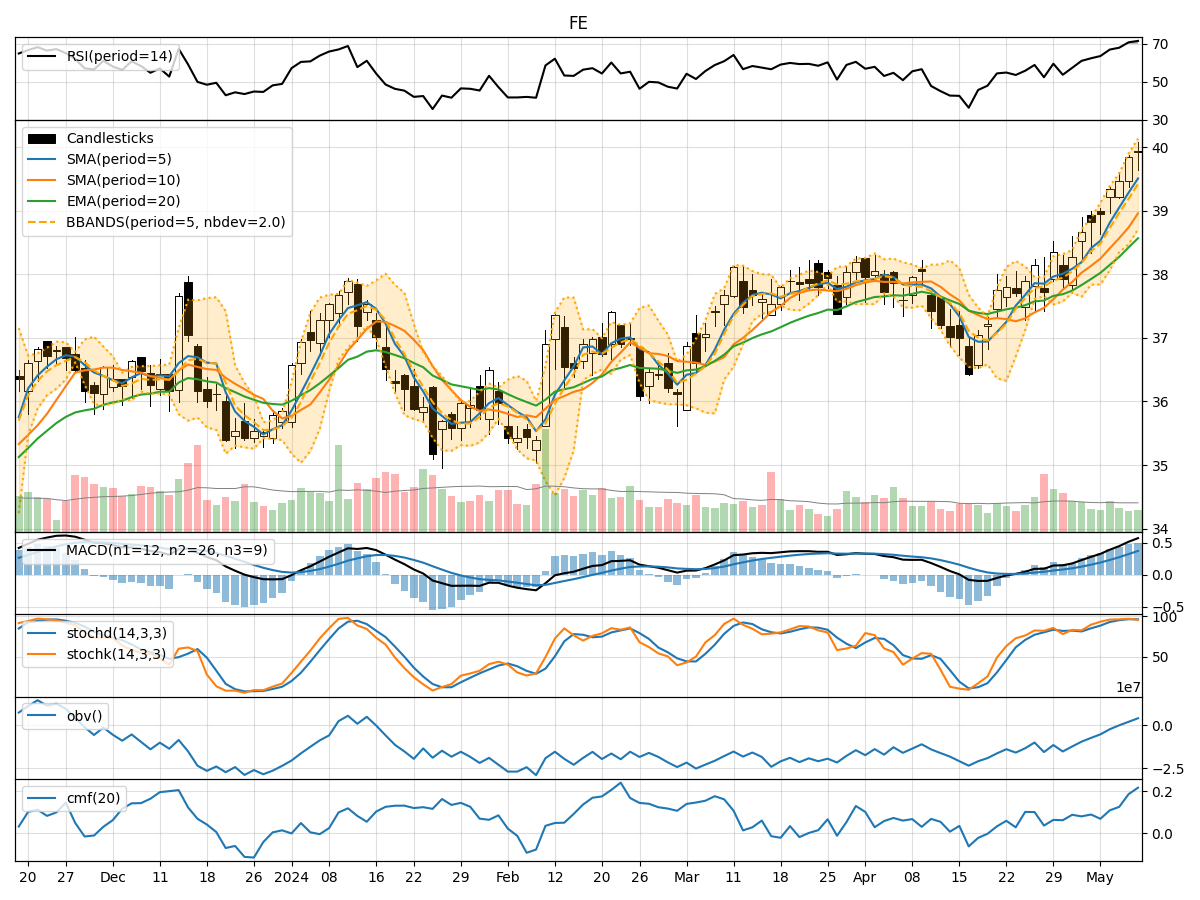
- Moving Averages (MA): The 5-day Moving Average (MA) has been consistently rising, indicating a bullish trend in the short term.
- MACD: The MACD line has been above the signal line for the past 5 days, suggesting a bullish momentum.
- EMA: The Exponential Moving Average (EMA) has been steadily increasing, supporting the bullish trend.
Momentum Analysis:
- RSI: The Relative Strength Index (RSI) has been in the overbought territory, indicating a strong bullish momentum.
- Stochastic Oscillator: Both %K and %D have been in the overbought zone, signaling a strong buying pressure.
- Williams %R: The Williams %R is in the oversold region, suggesting a potential reversal in the short term.
Volatility Analysis:
- Bollinger Bands (BB): The stock price has been trading above the upper Bollinger Band, indicating an overbought condition.
- Bollinger Band Width (BBW): The BBW has been narrowing, suggesting a decrease in volatility.
- Bollinger Band %B (BBP): The %B is above 0.8, indicating a potential overbought situation.
Volume Analysis:
- On-Balance Volume (OBV): The OBV has been steadily increasing, reflecting strong buying volume.
- Chaikin Money Flow (CMF): The CMF has been positive for the past 5 days, indicating a bullish money flow.
Key Observations:
- The technical indicators collectively suggest a strong bullish sentiment in the stock.
- The momentum indicators indicate a high buying pressure and overbought conditions.
- The volatility indicators point towards a potential overbought situation and decreasing volatility.
- The volume indicators support the bullish trend with increasing buying volume.
Conclusion:
Based on the analysis of the technical indicators, the stock is likely to continue its upward momentum in the coming days. However, caution should be exercised as some indicators are showing overbought conditions, which might lead to a short-term correction. Investors should closely monitor the price action and key support levels to assess the sustainability of the bullish trend. Overall, the outlook for FE stock remains bullish in the near term.