Technical Analysis of FDS 2024-05-10
Overview:
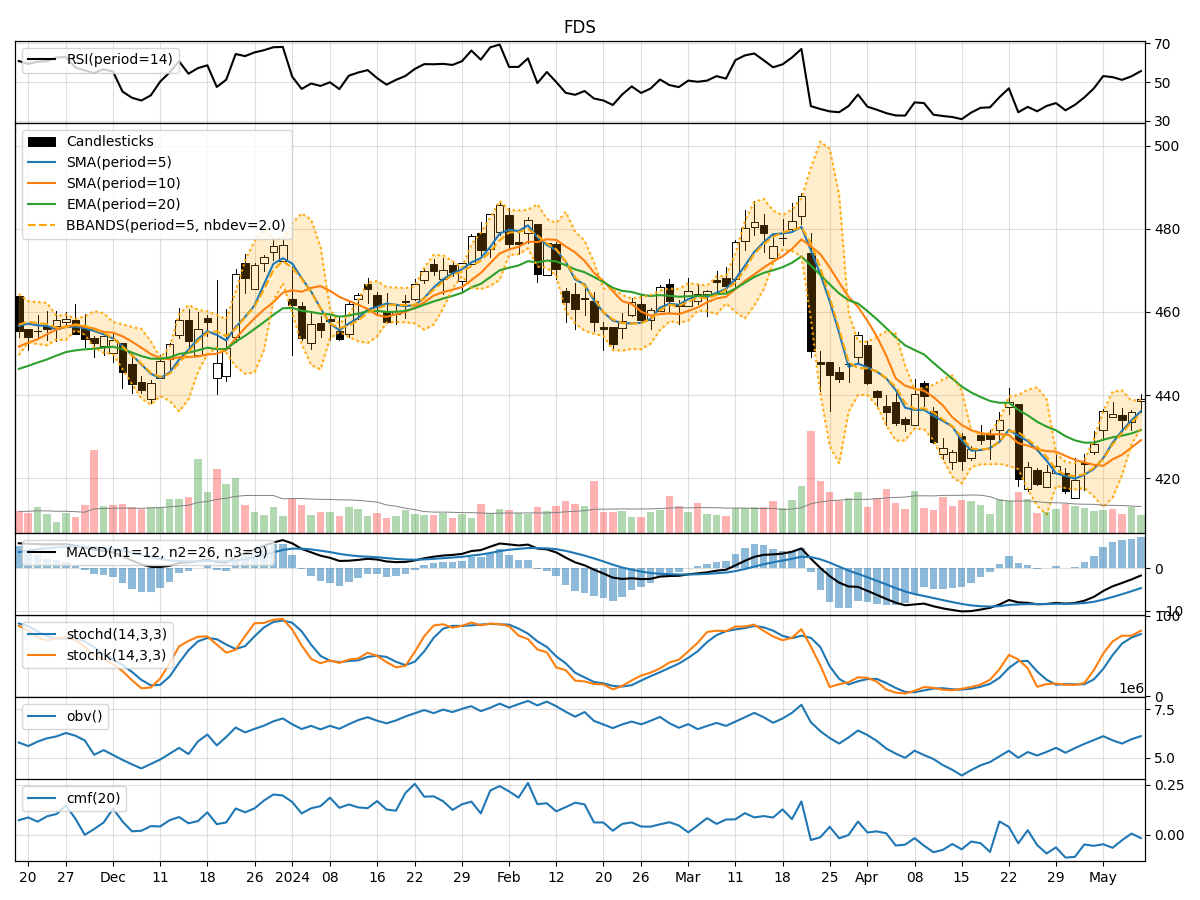
In analyzing the technical indicators for FDS over the last 5 days, we will delve into the trend, momentum, volatility, and volume indicators to provide a comprehensive outlook on the possible stock price movement in the coming days.
Trend Analysis:
- Moving Averages (MA): The 5-day Moving Average (MA) has been consistently rising, indicating a bullish trend.
- MACD: The MACD line has been increasing, while the MACD Histogram has been moving towards the zero line, suggesting a potential bullish crossover.
- EMA: The Exponential Moving Average (EMA) has been trending upwards, supporting the bullish sentiment.
Momentum Analysis:
- RSI: The Relative Strength Index (RSI) has been increasing, indicating strengthening momentum.
- Stochastic Oscillator: Both %K and %D have been rising, showing bullish momentum.
- Williams %R: The indicator has been moving towards oversold levels, potentially signaling a buying opportunity.
Volatility Analysis:
- Bollinger Bands (BB): The bands have been narrowing, suggesting decreasing volatility.
- BB %B: The %B indicator is below 1, indicating the price is below the lower Bollinger Band, potentially oversold.
Volume Analysis:
- On-Balance Volume (OBV): The OBV has been declining, indicating selling pressure.
- Chaikin Money Flow (CMF): The CMF has been negative, suggesting outflow of money from the stock.
Key Observations:
- The trend indicators point towards a bullish sentiment with rising moving averages and MACD.
- Momentum indicators show increasing strength in buying pressure with RSI and Stochastic Oscillator on the rise.
- Volatility indicators suggest a decrease in volatility, potentially leading to a period of consolidation.
- Volume indicators indicate selling pressure with declining OBV and negative CMF.
Conclusion:
Based on the analysis of the technical indicators, the next few days for FDS are likely to see upward movement in the stock price. The bullish trend, supported by momentum indicators and narrowing volatility, indicates a potential for price appreciation. However, caution is advised due to the negative volume indicators, which suggest ongoing selling pressure. Traders may consider entering long positions cautiously, while investors should monitor the situation closely for any signs of reversal in volume dynamics.