Technical Analysis of FBP 2024-05-10
Overview:
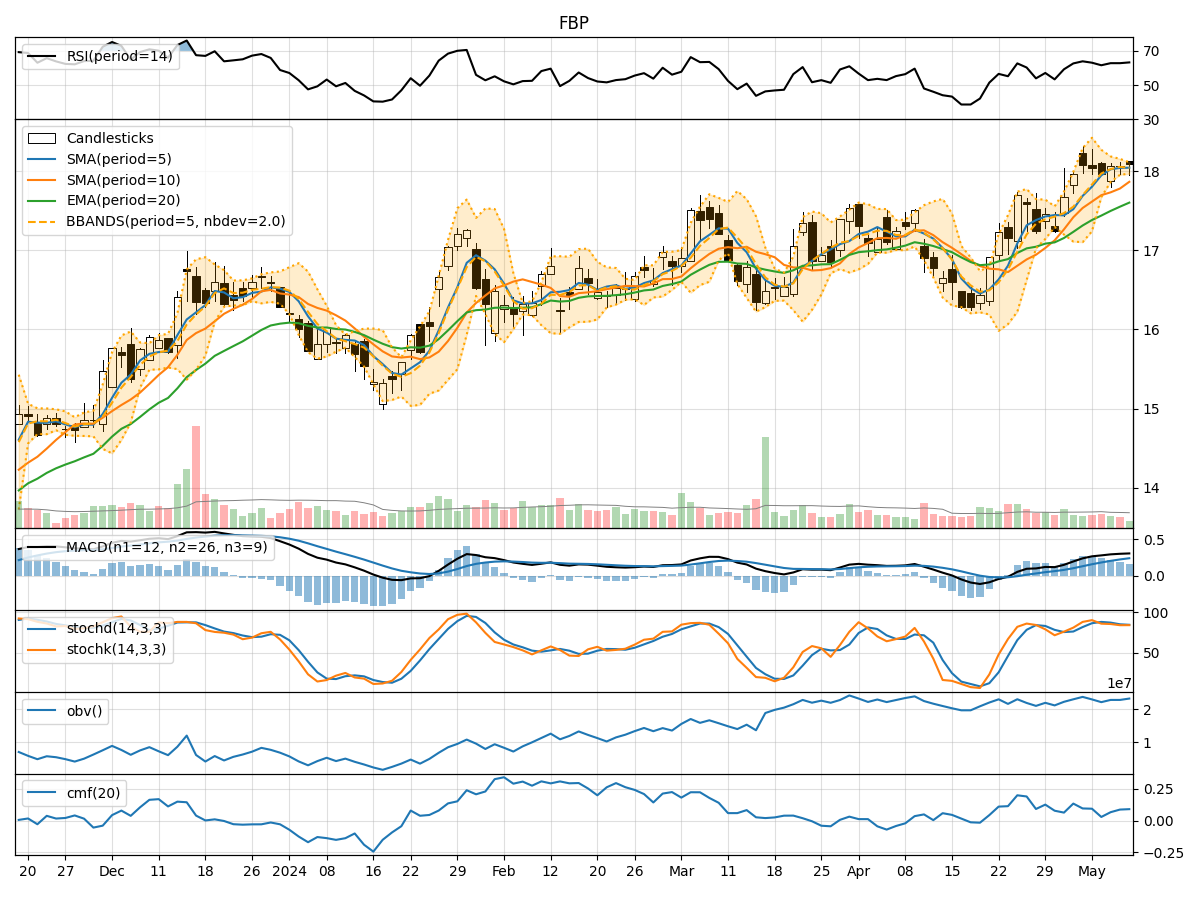
In analyzing the technical indicators for FBP over the last 5 days, we will delve into the trend, momentum, volatility, and volume indicators to provide a comprehensive outlook on the possible stock price movement in the coming days. By examining key metrics such as moving averages, MACD, RSI, Bollinger Bands, and OBV, we aim to offer valuable insights and predictions for potential price action.
Trend Indicators:
- Moving Averages (MA): The 5-day MA has been consistently above the closing prices, indicating a short-term uptrend.
- MACD: The MACD line has been above the signal line, suggesting bullish momentum.
- EMA: The exponential moving average has been trending upwards, supporting the bullish sentiment.
Momentum Indicators:
- RSI: The RSI has been in the neutral zone around 60-65, indicating neither overbought nor oversold conditions.
- Stochastic Oscillator: Both %K and %D have been hovering around 80, suggesting a strong bullish momentum.
- Williams %R: The indicator has been in the oversold territory, potentially signaling a reversal.
Volatility Indicators:
- Bollinger Bands: The stock price has been trading within the bands, indicating normal volatility.
- Bollinger %B: The %B indicator has been fluctuating around 0.5, suggesting equilibrium between volatility and price movement.
Volume Indicators:
- On-Balance Volume (OBV): The OBV has been relatively stable, indicating consistent buying pressure.
- Chaikin Money Flow (CMF): The CMF has been positive, reflecting a healthy inflow of money into the stock.
Key Observations:
- The trend indicators point towards a bullish sentiment with moving averages and MACD supporting an upward trajectory.
- Momentum indicators suggest a strong bullish momentum, especially with the Stochastic Oscillator showing overbought conditions.
- Volatility indicators indicate normal price fluctuations within the Bollinger Bands.
- Volume indicators reflect consistent buying pressure and positive money flow into the stock.
Conclusion:
Based on the analysis of the technical indicators, the stock is likely to continue its upward movement in the next few days. The bullish trend supported by moving averages, MACD, and strong momentum indicators indicates a favorable outlook for FBP. Traders and investors may consider buying opportunities in anticipation of further price appreciation. It is essential to monitor the indicators closely for any signs of reversal or overbought conditions.