Technical Analysis of EXK 2024-05-10
Overview:
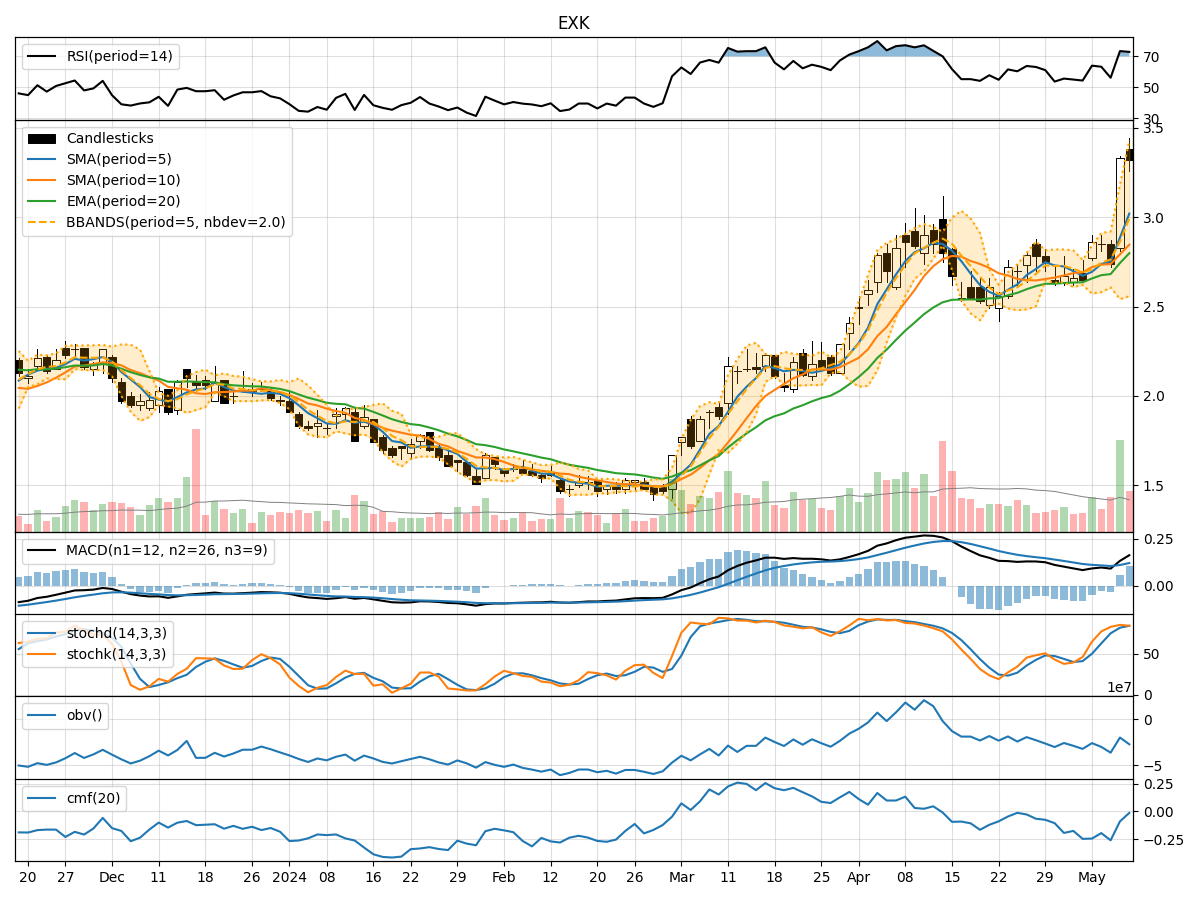
In analyzing the technical indicators for EXK over the last 5 days, we will delve into the trend, momentum, volatility, and volume indicators to provide a comprehensive outlook on the possible stock price movement in the coming days.
Trend Analysis:
- Moving Averages (MA): The 5-day Moving Average (MA) has been showing an upward trend, indicating a positive momentum in the stock price.
- MACD: The Moving Average Convergence Divergence (MACD) has been consistently positive, suggesting a bullish trend in the stock.
- EMA: The Exponential Moving Average (EMA) has been steadily increasing, further supporting the bullish sentiment in the stock.
Momentum Analysis:
- RSI: The Relative Strength Index (RSI) has been hovering around the overbought territory, indicating a strong bullish momentum.
- Stochastic Oscillator: Both %K and %D have been in the overbought zone, signaling a potential reversal or consolidation in the stock price.
- Williams %R: The Williams %R is also in the oversold region, suggesting a possible pullback in the stock price.
Volatility Analysis:
- Bollinger Bands: The Bollinger Bands have been widening, indicating increased volatility in the stock price.
- Bollinger %B: The %B indicator has been fluctuating, reflecting the volatility in the stock.
- Bollinger Band Width: The Band Width has been expanding, suggesting a potential increase in price fluctuations.
Volume Analysis:
- On-Balance Volume (OBV): The OBV has been fluctuating, indicating mixed buying and selling pressure in the stock.
- Chaikin Money Flow (CMF): The CMF has been negative, suggesting a bearish sentiment in the stock.
Key Observations:
- The trend indicators point towards a bullish sentiment in the stock, supported by the positive moving averages and MACD.
- The momentum indicators, particularly the RSI and Stochastic Oscillator, suggest a strong bullish momentum but also indicate potential overbought conditions.
- Volatility indicators show an increase in price fluctuations, which could lead to both upside and downside movements.
- The volume indicators reflect mixed buying and selling pressure, with the CMF indicating a bearish sentiment.
Conclusion:
Based on the analysis of the technical indicators, the stock of EXK is currently in an overbought state with a bullish bias. However, the high volatility and mixed volume signals suggest a potential consolidation or pullback in the stock price in the coming days. Traders should exercise caution and consider taking profits or implementing risk management strategies in anticipation of a possible correction.