Technical Analysis of EW 2024-05-10
Overview:
In the last 5 trading days, the stock price has shown some fluctuations with a mix of bullish and bearish signals across various technical indicators. We will analyze the trend, momentum, volatility, and volume indicators to provide insights into the possible future stock price movement.
Trend Indicators:
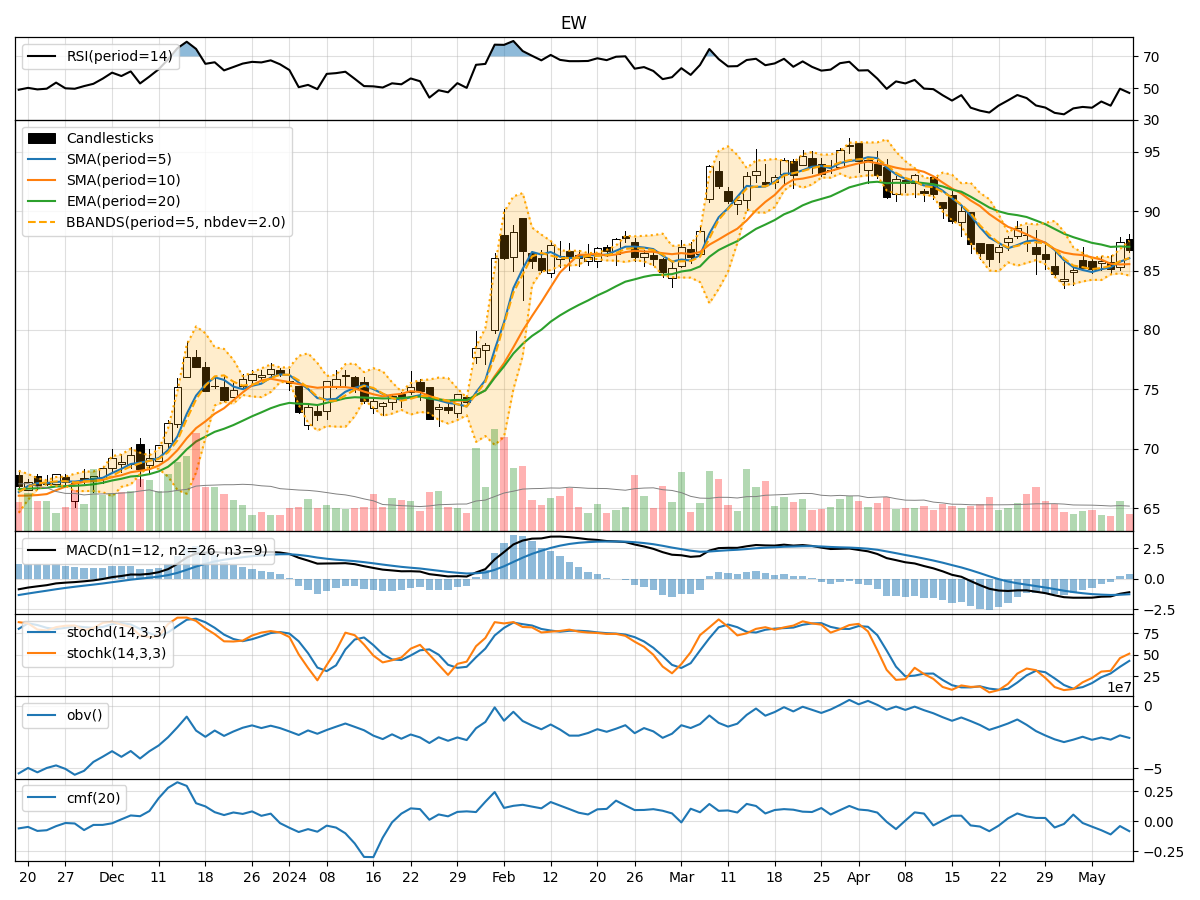
- Moving Averages (MA): The 5-day MA has been fluctuating around the closing prices, indicating short-term volatility. The SMA(10) and EMA(20) are showing a downward trend, suggesting a bearish sentiment in the medium to long term.
- MACD: The MACD line has been consistently below the signal line, indicating a bearish trend. However, the MACD histogram has shown some signs of convergence, hinting at a possible trend reversal.
Momentum Indicators:
- RSI: The RSI has been fluctuating in the neutral zone, indicating indecision in the market. It has not reached oversold or overbought levels, suggesting a lack of strong momentum in either direction.
- Stochastic Oscillator: The Stochastic indicators have been moving towards the overbought zone, indicating a potential bullish momentum building up. However, the Stochastic D line has not confirmed this signal yet.
Volatility Indicators:
- Bollinger Bands: The stock price has been trading within the Bollinger Bands, suggesting a period of consolidation. The bands have not shown any significant expansion or contraction, indicating stable volatility.
- Bollinger %B: The %B indicator is hovering around the midline, further confirming the consolidation phase with no clear direction.
Volume Indicators:
- On-Balance Volume (OBV): The OBV has been fluctuating, indicating mixed buying and selling pressure. The declining OBV suggests some distribution happening in the stock.
- Chaikin Money Flow (CMF): The CMF has been negative, indicating that money is flowing out of the stock. This aligns with the bearish sentiment observed in other indicators.
Conclusion:
Based on the analysis of the technical indicators, the stock is currently in a consolidation phase with no clear trend direction. The mixed signals from the trend, momentum, volatility, and volume indicators suggest a lack of strong conviction from market participants. Considering the overall picture, it is advisable to exercise caution and wait for more definitive signals before making any significant trading decisions. The stock is likely to continue trading sideways in the near term until a clear trend emerges.