Technical Analysis of ETR 2024-05-10
Overview:
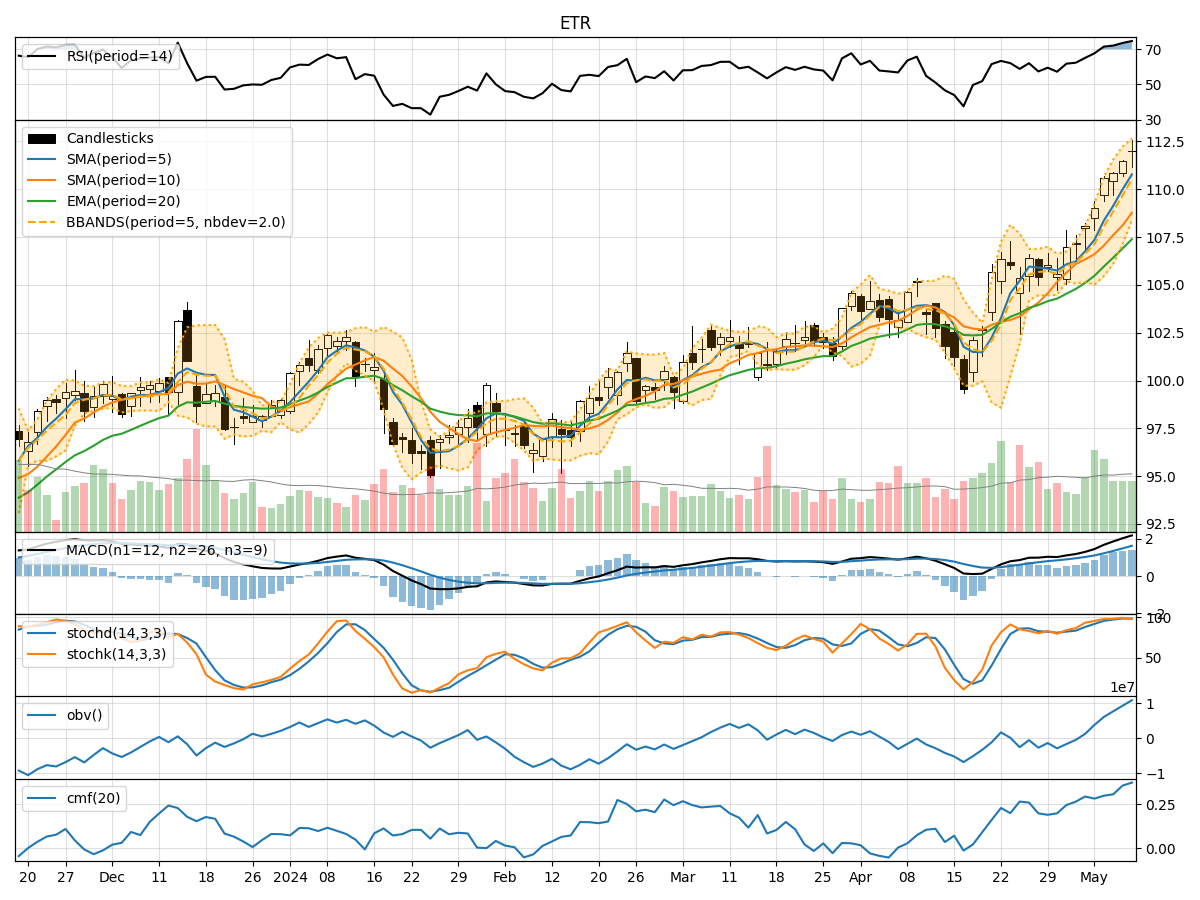
In analyzing the technical indicators for ETR over the last 5 days, we will delve into the trend, momentum, volatility, and volume indicators to provide a comprehensive outlook on the possible stock price movement in the coming days.
Trend Analysis:
- Moving Averages (MA): The 5-day Moving Average has been consistently rising, indicating a bullish trend in the short term.
- MACD: The MACD line has been above the signal line, suggesting a bullish momentum.
- EMA: The Exponential Moving Average has been trending upwards, supporting the bullish sentiment.
Momentum Analysis:
- RSI: The Relative Strength Index has been in the overbought territory, indicating a strong bullish momentum.
- Stochastic Oscillator: Both %K and %D have been in the overbought zone, signaling a potential reversal or consolidation.
- Williams %R: The indicator has been in the oversold region, suggesting a possible reversal to the upside.
Volatility Analysis:
- Bollinger Bands: The stock price has been trading near the upper Bollinger Band, indicating high volatility and a potential overbought condition.
- Bollinger %B: The %B indicator has been above 0.8, signaling a potential overbought situation.
Volume Analysis:
- On-Balance Volume (OBV): The OBV has been steadily increasing, reflecting strong buying pressure.
- Chaikin Money Flow (CMF): The CMF has been positive, indicating money flow into the stock.
Key Observations:
- The trend indicators suggest a strong bullish sentiment in the short term.
- Momentum indicators show overbought conditions, hinting at a possible reversal or consolidation.
- Volatility indicators point towards high volatility and a potential overbought scenario.
- Volume indicators reflect strong buying pressure and positive money flow into the stock.
Conclusion:
Based on the analysis of the technical indicators, the next few days' possible stock price movement for ETR is likely to be consolidation or a minor pullback. The stock has shown signs of being overbought, and the momentum indicators suggest a potential reversal or sideways movement. Traders may consider taking profits or waiting for a better entry point before considering long positions. It is essential to monitor the price action closely for any signs of a trend reversal or continuation.