Technical Analysis of ESS 2024-05-10
Overview:
In analyzing the technical indicators for ESS stock over the last 5 days, we will delve into the trend, momentum, volatility, and volume indicators to provide a comprehensive outlook on the possible stock price movement in the coming days. By examining these key indicators, we aim to offer valuable insights and predictions to guide your investment decisions.
Trend Analysis:
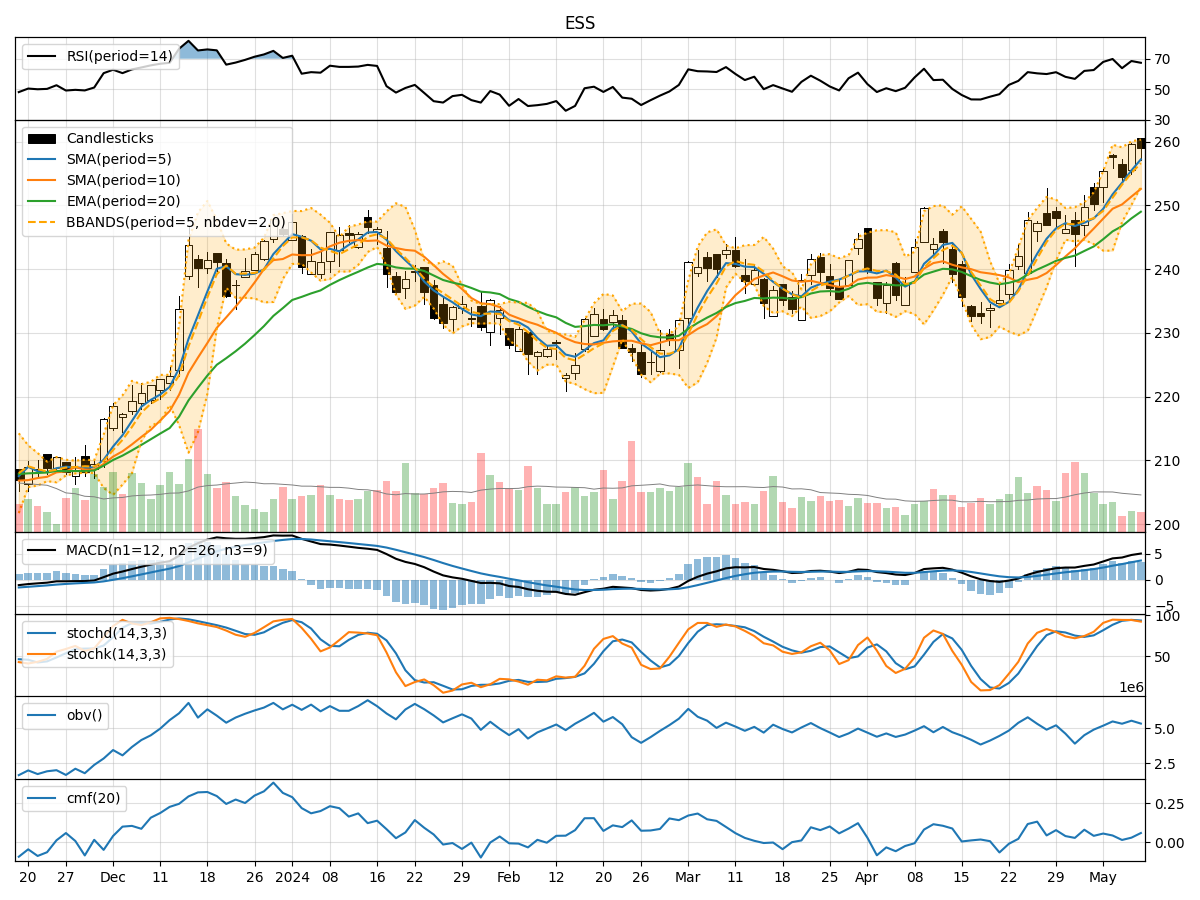
- Moving Averages (MA): The 5-day moving average has been consistently rising, indicating a bullish trend in the short term.
- MACD: The MACD line has been increasing, crossing above the signal line, suggesting a strengthening bullish momentum.
- Relative Strength Index (RSI): The RSI values have been fluctuating but generally staying within the neutral to overbought territory, reflecting mixed sentiment.
Momentum Analysis:
- Stochastic Oscillator: The stochastic indicators have been relatively high, signaling overbought conditions in the market.
- Williams %R (WillR): The Williams %R values have been fluctuating but mostly indicating overbought conditions.
Volatility Analysis:
- Bollinger Bands (BB): The Bollinger Bands have been narrowing, indicating decreasing volatility in the stock price.
- Bollinger %B (BBP): The %B values have been decreasing, suggesting a potential consolidation phase.
Volume Analysis:
- On-Balance Volume (OBV): The OBV has shown mixed movements, indicating indecision among market participants.
- Chaikin Money Flow (CMF): The CMF values have been positive but fluctuating, reflecting mixed buying pressure.
Conclusion:
Based on the analysis of the technical indicators, the stock is currently exhibiting overbought conditions in terms of momentum and volatility is decreasing, possibly leading to a consolidation phase in the coming days. The trend remains bullish in the short term, supported by the moving averages and MACD. However, the high stochastic and Williams %R values suggest a potential pullback or correction in the near future.
Recommendation:
Considering the mixed signals from the indicators, it is advisable to exercise caution in trading ESS stock in the next few days. Investors may consider taking profits if they have significant gains and wait for a clearer trend confirmation before entering new positions. Monitoring the price action closely and setting appropriate stop-loss levels can help manage risks effectively in this uncertain market environment.