Technical Analysis of ES 2024-05-10
Overview:
In analyzing the technical indicators for the ES stock over the last 5 days, we will delve into the trend, momentum, volatility, and volume indicators to provide a comprehensive outlook on the possible stock price movement in the coming days. By examining these key indicators, we aim to offer valuable insights and predictions to guide your investment decisions.
Trend Analysis:
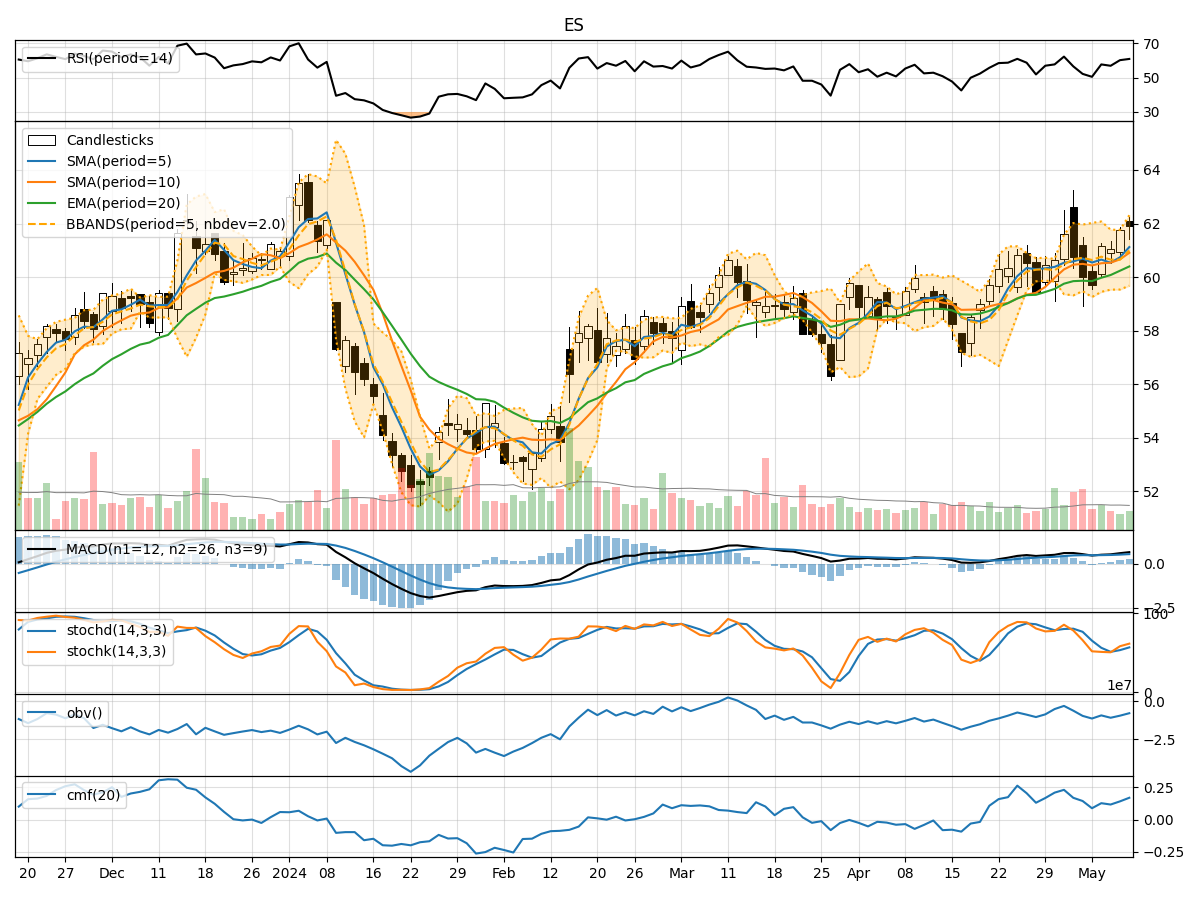
- Moving Averages (MA): The 5-day Moving Average (MA) has been steadily increasing, indicating a positive trend in the stock price.
- MACD: The MACD line has been consistently above the signal line, suggesting bullish momentum in the stock.
- EMA: The Exponential Moving Average (EMA) has been on an upward trajectory, further supporting the bullish trend.
Momentum Analysis:
- RSI: The Relative Strength Index (RSI) has been trending upwards, indicating increasing buying pressure and potential for further price appreciation.
- Stochastic Oscillator: Both %K and %D lines of the Stochastic Oscillator have been rising, signaling strong bullish momentum.
- Williams %R: The Williams %R indicator has been consistently in the oversold territory, suggesting a potential reversal to the upside.
Volatility Analysis:
- Bollinger Bands: The Bollinger Bands have been widening, indicating increased volatility in the stock price.
- Bollinger %B: The %B indicator has been fluctuating within a range, reflecting the volatility in the stock.
Volume Analysis:
- On-Balance Volume (OBV): The OBV indicator has been trending upwards, suggesting accumulation of the stock by investors.
- Chaikin Money Flow (CMF): The CMF indicator has been positive, indicating buying pressure in the stock.
Key Observations:
- The technical indicators collectively point towards a bullish outlook for the ES stock in the coming days.
- The positive trends in moving averages, MACD, RSI, and Stochastic Oscillator indicate strong upward momentum.
- The increasing OBV and positive CMF suggest growing investor interest and buying activity in the stock.
- The widening Bollinger Bands indicate heightened volatility, which could lead to significant price movements.
Conclusion:
Based on the analysis of the technical indicators, the ES stock is likely to experience further upward movement in the next few days. Investors may consider buying or holding positions in anticipation of potential price appreciation. It is important to monitor the volatility and set appropriate risk management strategies to navigate market fluctuations effectively. Overall, the current technical outlook supports a bullish stance on the ES stock.