Technical Analysis of ERJ 2024-05-10
Overview:
In analyzing the technical indicators for ERJ over the last 5 days, we will delve into the trend, momentum, volatility, and volume indicators to provide a comprehensive outlook on the possible stock price movement in the coming days. By examining these key indicators, we aim to offer valuable insights and predictions for potential investors.
Trend Analysis:
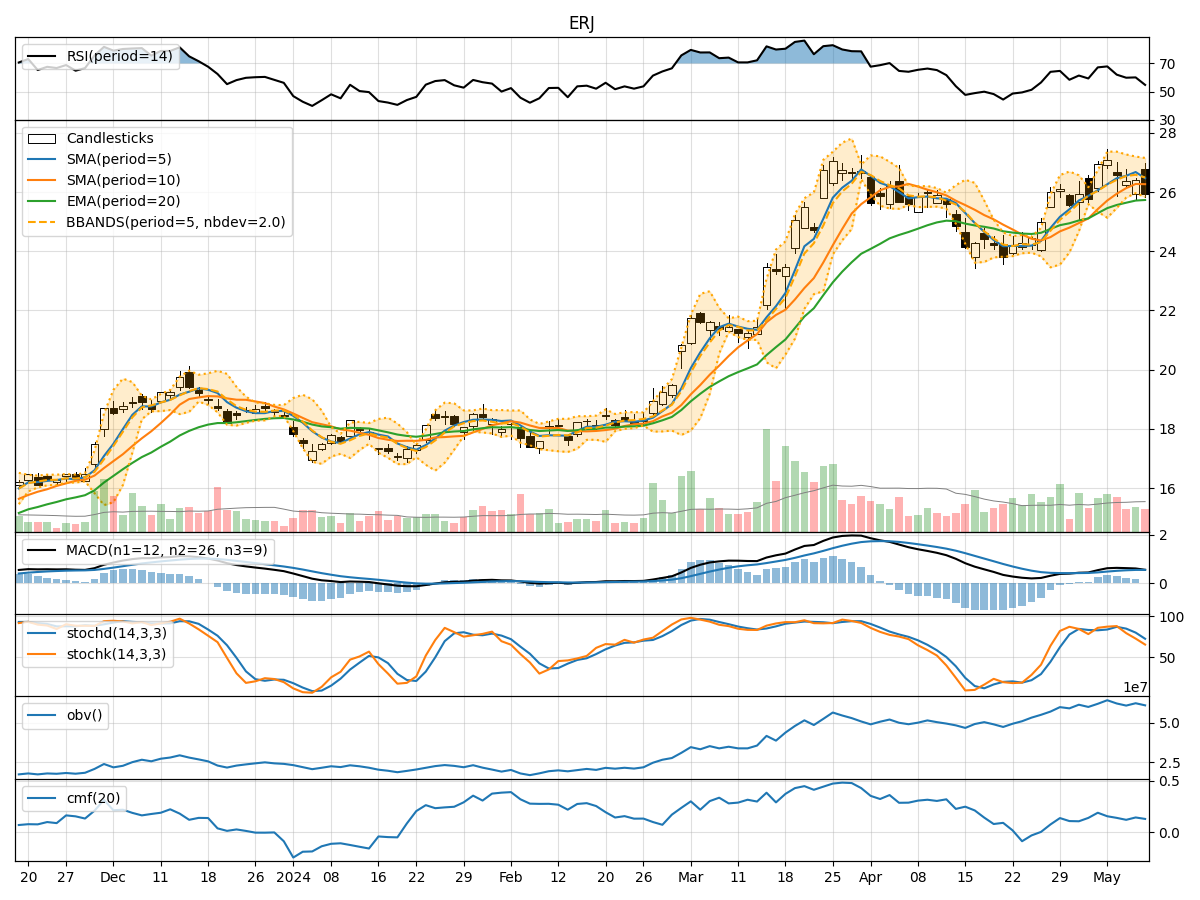
- Moving Averages (MA): The 5-day Moving Average (MA) has been consistently above the Simple Moving Average (SMA) and Exponential Moving Average (EMA), indicating a bullish trend.
- MACD: The MACD line has been above the signal line, with both lines showing a positive trend, suggesting bullish momentum.
- MACD Histogram: The MACD Histogram has been mostly positive, indicating increasing bullish momentum.
Momentum Analysis:
- RSI: The Relative Strength Index (RSI) has been fluctuating but generally staying above 50, indicating a neutral to slightly bullish momentum.
- Stochastic Oscillator: Both %K and %D have been declining but are still in the overbought territory, suggesting a potential reversal or consolidation.
- Williams %R: The Williams %R has been in the oversold territory, indicating a potential buying opportunity.
Volatility Analysis:
- Bollinger Bands: The stock price has mostly stayed within the Bollinger Bands, with the bands narrowing, suggesting decreasing volatility.
- Bollinger %B: The %B indicator has been fluctuating around the midline, indicating a neutral stance.
Volume Analysis:
- On-Balance Volume (OBV): The OBV has been fluctuating but has not shown a clear trend, indicating mixed sentiment among investors.
- Chaikin Money Flow (CMF): The CMF has been positive but decreasing, suggesting a potential weakening of buying pressure.
Key Observations:
- The trend indicators suggest a bullish sentiment, supported by the moving averages and MACD.
- Momentum indicators show a mixed picture, with RSI indicating a neutral stance and stochastic oscillators hinting at a potential reversal.
- Volatility has been decreasing, as indicated by the narrowing Bollinger Bands.
- Volume indicators show mixed sentiment, with OBV fluctuating and CMF indicating a slight decrease in buying pressure.
Conclusion:
Based on the analysis of the technical indicators, the overall outlook for ERJ in the next few days is cautiously bullish. While the trend indicators suggest a positive momentum, the mixed signals from momentum, volatility, and volume indicators indicate a potential for consolidation or a minor pullback before a possible continuation of the bullish trend. Traders should closely monitor key support and resistance levels for confirmation of the bullish bias and consider implementing risk management strategies to navigate potential market fluctuations.