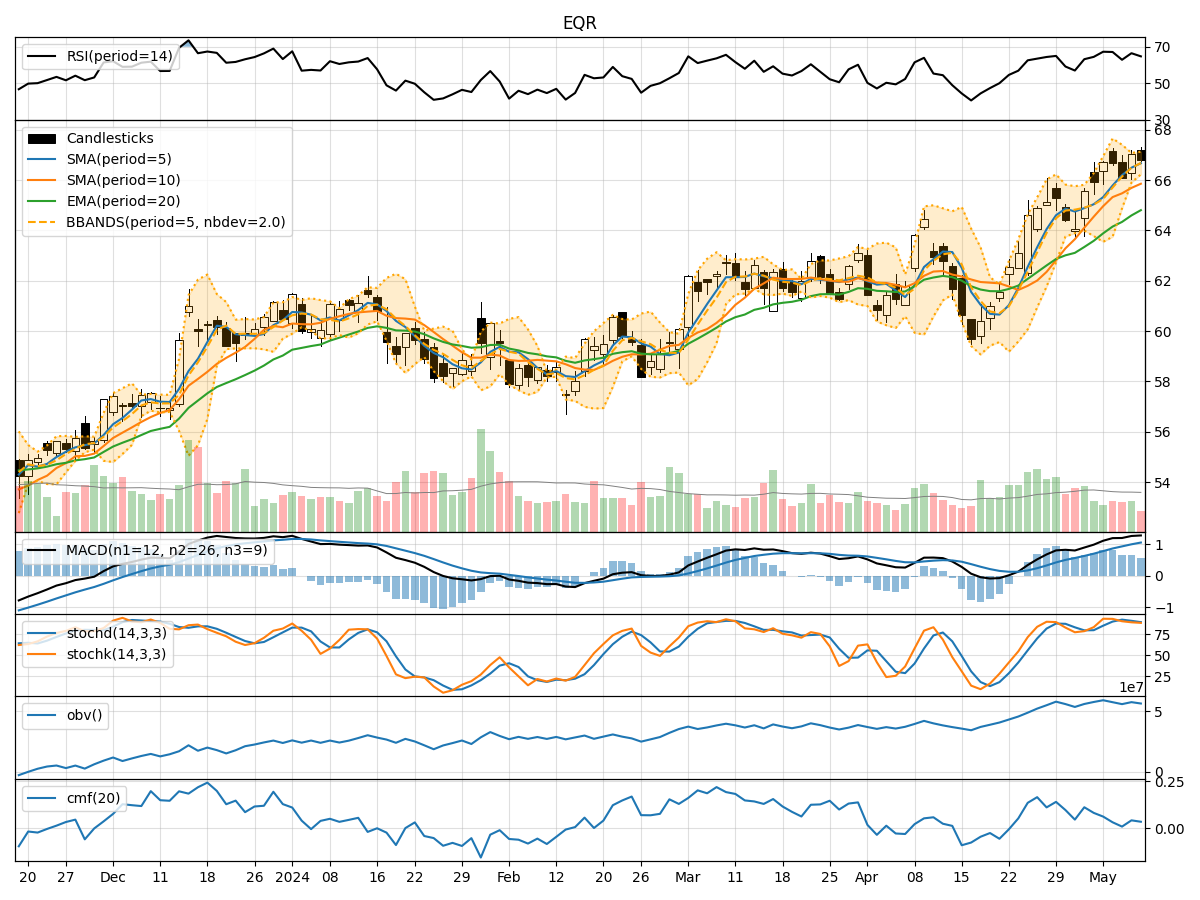
Technical Analysis of EQR 2024-05-10
Overview:
In analyzing the technical indicators for EQR over the last 5 days, we will delve into the trend, momentum, volatility, and volume indicators to provide a comprehensive outlook on the possible stock price movement. By examining these key aspects, we aim to offer valuable insights and predictions for the upcoming days.
Trend Analysis:
- Moving Averages (MA): The 5-day Moving Average (MA) has been consistently above the Simple Moving Average (SMA) and Exponential Moving Average (EMA), indicating a bullish trend.
- MACD: The MACD line has been above the signal line, with both lines showing an upward trend, suggesting bullish momentum.
- Conclusion: The trend indicators point towards an upward trajectory for EQR.
Momentum Analysis:
- RSI: The Relative Strength Index (RSI) has been fluctuating but generally staying within the neutral to overbought range, indicating mixed momentum.
- Stochastic Oscillator: Both %K and %D have been relatively high, suggesting overbought conditions.
- Conclusion: The momentum indicators suggest a mixed sentiment with a slight bias towards overbought levels.
Volatility Analysis:
- Bollinger Bands (BB): The stock price has mostly stayed within the Bollinger Bands, with the bands narrowing, indicating decreasing volatility.
- Conclusion: Volatility has been decreasing, signaling a potential consolidation phase.
Volume Analysis:
- On-Balance Volume (OBV): The OBV has shown fluctuations but has not diverged significantly from the price movement, indicating a balanced volume trend.
- Chaikin Money Flow (CMF): The CMF has been positive but relatively flat, suggesting stable money flow.
- Conclusion: Volume indicators reflect a neutral stance with no clear divergence.
Overall Conclusion:
Based on the analysis of trend, momentum, volatility, and volume indicators, the next few days for EQR are likely to see a sideways movement with a slight upward bias. The trend remains bullish, supported by the MACD, while momentum shows a mixed sentiment leaning towards overbought levels. Volatility is decreasing, hinting at a potential consolidation phase, and volume indicators suggest a balanced volume trend.
Key Recommendations:
- Monitor Price Action: Keep a close eye on how the stock price behaves within the Bollinger Bands for potential breakout or reversal signals.
- Watch Momentum Levels: Pay attention to the RSI and Stochastic Oscillator for any signs of a reversal from overbought conditions.
- Consider Market Sentiment: Stay informed about any external factors or news that could impact EQR's price movement.
In conclusion, while the overall outlook for EQR suggests a sideways movement with a slight upward bias, it is essential to remain vigilant and adapt to changing market conditions.