Technical Analysis of ENB 2024-05-10
Overview:
In analyzing the technical indicators for ENB over the last 5 days, we will delve into the trend, momentum, volatility, and volume indicators to provide a comprehensive outlook on the possible stock price movement. By examining these key aspects, we aim to offer valuable insights and predictions for the upcoming trading days.
Trend Indicators:
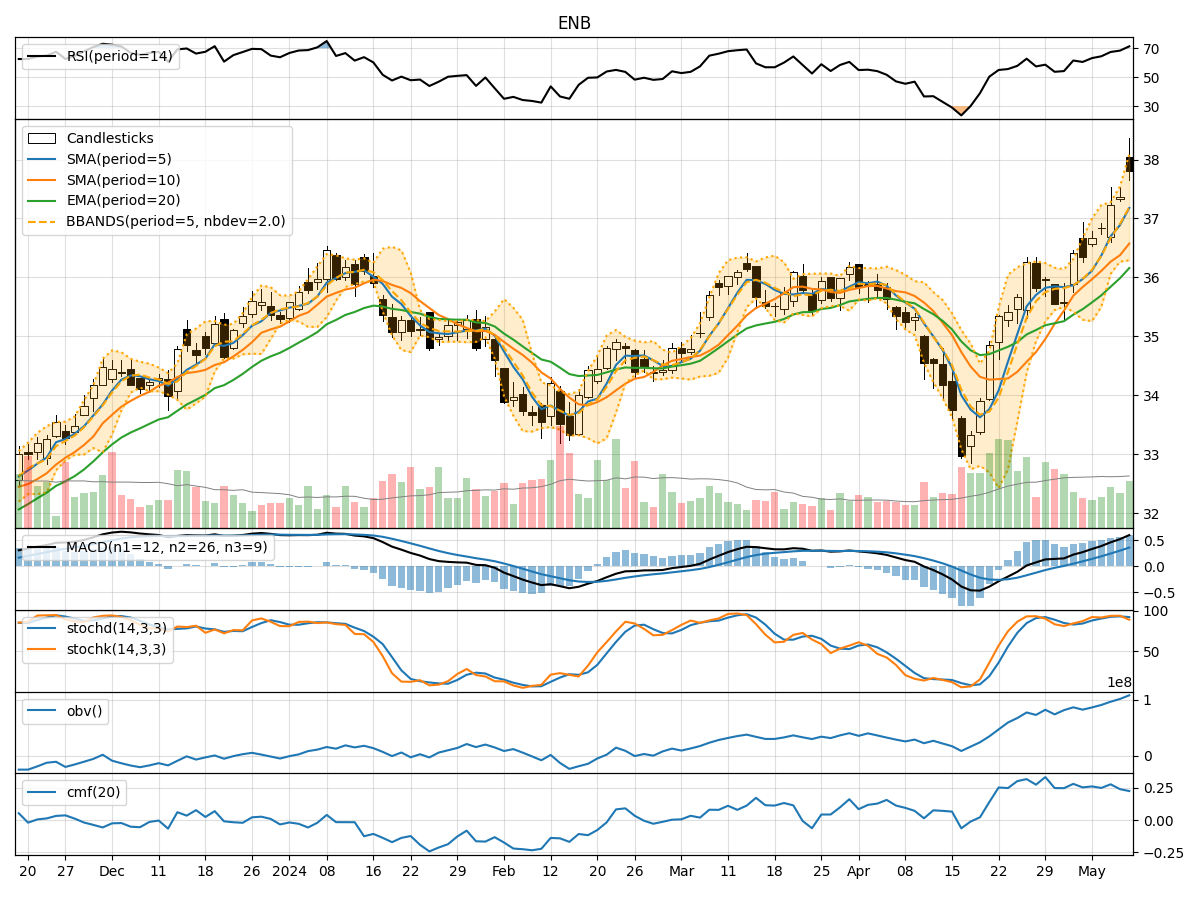
- Moving Averages (MA): The 5-day Moving Average has been consistently rising, indicating a bullish trend in the short term.
- MACD: The MACD line has been increasing, crossing above the signal line, suggesting a strengthening bullish momentum.
- EMA: The Exponential Moving Average has been trending upwards, supporting the bullish sentiment in the stock.
Momentum Indicators:
- RSI: The Relative Strength Index has been in the overbought territory, signaling a strong bullish momentum.
- Stochastic Oscillator: Both %K and %D have been relatively high, indicating an overbought condition.
- Williams %R: The indicator has been in the oversold region, suggesting a potential reversal in the short term.
Volatility Indicators:
- Bollinger Bands: The stock price has been trading near the upper Bollinger Band, indicating high volatility and a potential overbought condition.
- Bollinger %B: The %B value is above 0.8, suggesting a potential overbought situation.
Volume Indicators:
- On-Balance Volume (OBV): The OBV has been steadily increasing, reflecting strong buying pressure in the stock.
- Chaikin Money Flow (CMF): The CMF has been positive, indicating that money is flowing into the stock.
Key Observations:
- The trend indicators suggest a strong bullish sentiment in the stock, supported by rising moving averages and MACD.
- Momentum indicators indicate an overbought condition, which might lead to a short-term correction.
- Volatility indicators point towards high volatility and a potential overbought situation.
- Volume indicators show strong buying pressure and positive money flow into the stock.
Conclusion:
Based on the analysis of the technical indicators, the next few days' possible stock price movement for ENB is likely to experience a short-term correction or consolidation due to the overbought conditions indicated by the momentum and volatility indicators. However, the overall trend remains bullish in the near term, supported by the positive trend indicators and strong buying pressure reflected in the volume indicators. Traders should be cautious of a potential pullback in the stock price before considering further long positions.