Technical Analysis of EMR 2024-05-10
Overview:
In analyzing the technical indicators for Emerson Electric Co. (EMR) over the last 5 days, we will delve into the trend, momentum, volatility, and volume indicators to provide insights into the possible future stock price movement. By examining these key indicators, we aim to offer a comprehensive analysis and make informed predictions for the upcoming days.
Trend Indicators:
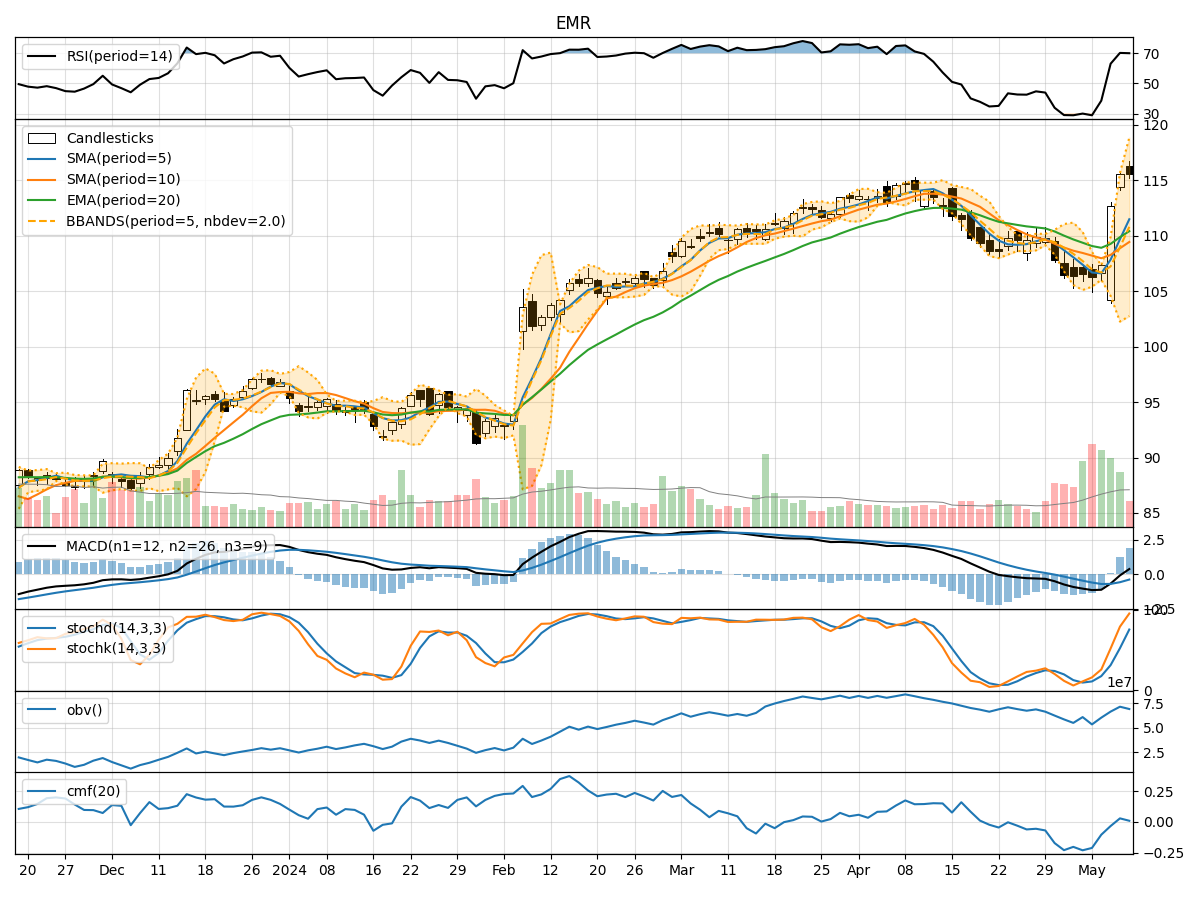
- Moving Averages (MA): The 5-day MA has been fluctuating around the closing prices, indicating short-term price trends. The Simple Moving Average (SMA) and Exponential Moving Average (EMA) show a slight divergence, with the EMA indicating a more recent uptrend.
- Moving Average Convergence Divergence (MACD): The MACD line has been positive for the last few days, suggesting a bullish momentum. The MACD Histogram has been increasing, indicating strengthening bullish momentum.
Momentum Indicators:
- Relative Strength Index (RSI): The RSI has been in the overbought territory, suggesting a potential reversal or consolidation in the near future.
- Stochastic Oscillator: Both %K and %D have been in the overbought zone, indicating a strong bullish momentum that might need to correct soon.
- Williams %R (Willams %R): The Williams %R has been in the oversold region, signaling a potential reversal to the upside.
Volatility Indicators:
- Bollinger Bands (BB): The Bollinger Bands have been widening, indicating increased volatility in the stock price. The current price is hovering around the upper band, suggesting a potential overbought condition.
- Bollinger %B (BB %B): The %B indicator is above 0.8, indicating a potential overbought condition and a likelihood of a price reversal.
Volume Indicators:
- On-Balance Volume (OBV): The OBV has been relatively flat, suggesting a balance between buying and selling pressure.
- Chaikin Money Flow (CMF): The CMF has been negative, indicating a bearish money flow in the stock.
Key Observations and Opinions:
- Trend: The trend indicators suggest a short-term bullish sentiment, with the MACD and moving averages pointing towards a potential uptrend.
- Momentum: The momentum indicators show overbought conditions, indicating a possible correction or consolidation in the near future.
- Volatility: The widening Bollinger Bands and high %B value suggest increased volatility and a potential reversal in price.
- Volume: The volume indicators show a lack of strong buying or selling pressure, indicating a neutral stance.
Conclusion:
Based on the analysis of the technical indicators, the stock price of EMR is likely to experience a short-term correction or consolidation in the upcoming days. The overbought momentum, high volatility, and lack of strong volume support suggest a potential pullback in the stock price. Traders should exercise caution and consider waiting for a better entry point before initiating new positions.