Technical Analysis of EMN 2024-05-10
Overview:
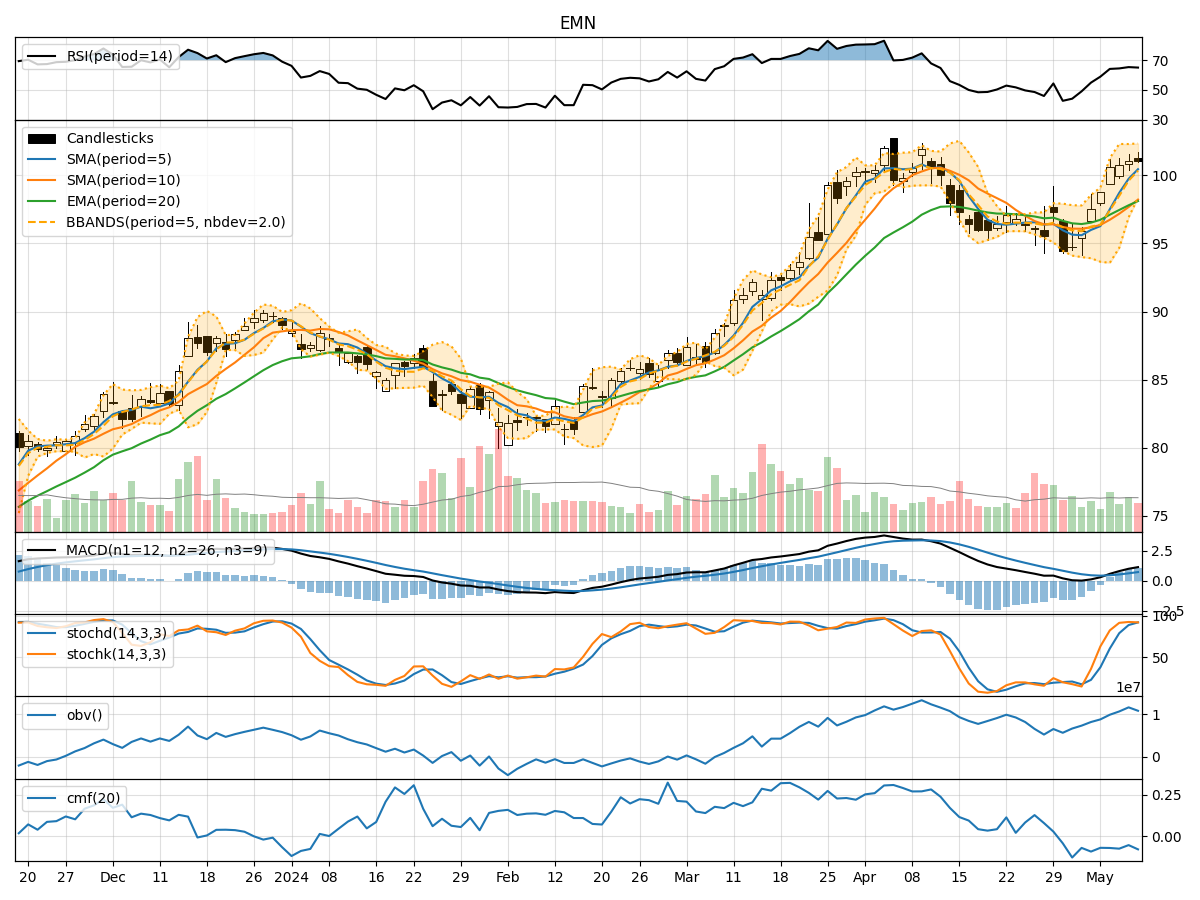
In analyzing the technical indicators for EMN over the last 5 days, we will delve into the trend, momentum, volatility, and volume indicators to provide a comprehensive outlook on the possible stock price movement. By examining these key aspects, we aim to offer valuable insights and predictions for the upcoming days.
Trend Indicators:
- Moving Averages (MA): The 5-day MA has been consistently rising, indicating a bullish trend in the short term.
- MACD: The MACD line has been above the signal line, suggesting positive momentum.
- EMA: The EMA has been trending upwards, supporting the bullish sentiment.
Key Observation: The trend indicators point towards a bullish outlook for EMN.
Momentum Indicators:
- RSI: The RSI has been increasing, showing strengthening buying momentum.
- Stochastic Oscillator: Both %K and %D have been in the overbought zone, indicating a strong bullish momentum.
- Williams %R: The indicator has been in the oversold territory, signaling a potential reversal.
Key Observation: Momentum indicators suggest a strong bullish sentiment for EMN.
Volatility Indicators:
- Bollinger Bands (BB): The bands have been widening, indicating increased volatility.
- BB %B: The %B has been decreasing, suggesting a potential pullback in price.
Key Observation: Volatility is on the rise, which could lead to larger price swings.
Volume Indicators:
- On-Balance Volume (OBV): The OBV has been increasing, reflecting higher buying volume.
- Chaikin Money Flow (CMF): The CMF has been negative, indicating selling pressure.
Key Observation: Volume indicators show mixed signals with increasing buying volume but negative CMF.
Conclusion:
Based on the analysis of the technical indicators, the next few days for EMN are likely to see continued bullish momentum in the stock price. The trend indicators, momentum indicators, and increasing buying volume all point towards a positive outlook. However, the increasing volatility and negative CMF signal caution. Therefore, investors should closely monitor the price action and consider implementing risk management strategies to navigate potential market fluctuations.
Recommendation:
- Consider entering long positions based on the bullish trend and momentum signals.
- Set stop-loss orders to protect against sudden price reversals due to increased volatility.
- Monitor the CMF and BB %B for any signs of a potential trend reversal.
By staying vigilant and adapting to changing market conditions, investors can capitalize on the current bullish momentum while managing risks effectively.