Technical Analysis of EFXT 2024-05-10
Overview:
In analyzing the technical indicators for EFXT over the last 5 days, we will delve into the trend, momentum, volatility, and volume indicators to provide a comprehensive assessment of the stock's potential price movement. By examining these key factors, we aim to offer valuable insights and predictions for the next few days.
Trend Indicators:
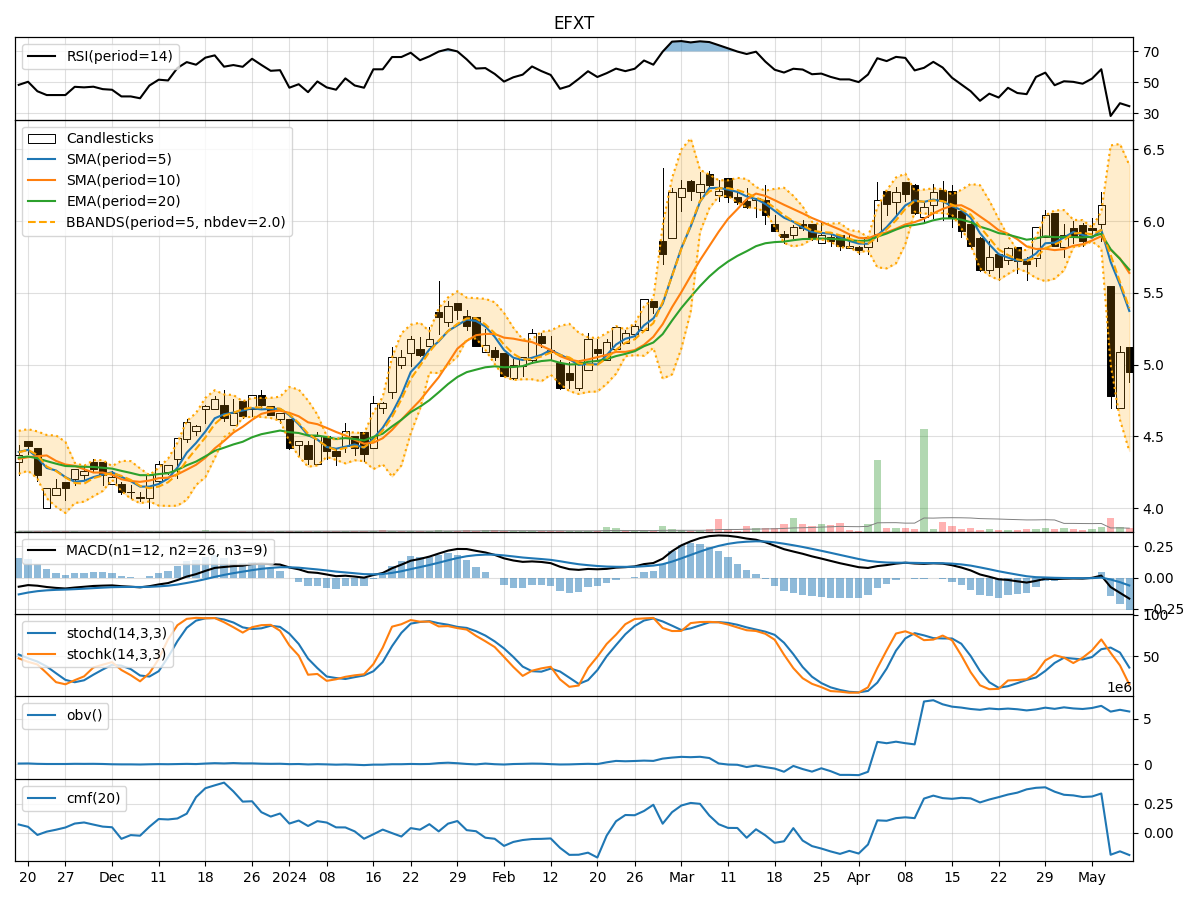
- Moving Averages (MA): The 5-day MA has been fluctuating around the closing prices, indicating short-term price trends. The Simple Moving Average (SMA) and Exponential Moving Average (EMA) show a downward trend, suggesting bearish sentiment.
- MACD: The MACD line has been consistently negative, with the MACD histogram also in the negative territory. This indicates a bearish trend in the stock price.
- Conclusion: The trend indicators suggest a bearish outlook for EFXT in the short term.
Momentum Indicators:
- RSI: The Relative Strength Index (RSI) has been hovering around the mid-level, indicating a neutral momentum.
- Stochastic Oscillator: Both %K and %D have been declining, showing a bearish momentum.
- Williams %R: The Williams %R is in oversold territory, signaling a potential reversal.
- Conclusion: The momentum indicators suggest a bearish sentiment with a possibility of a reversal due to the oversold condition.
Volatility Indicators:
- Bollinger Bands: The stock price has been trading below the lower Bollinger Band, indicating oversold conditions and potential for a reversal.
- Conclusion: The volatility indicators suggest a potential reversal in the stock price due to the oversold conditions.
Volume Indicators:
- On-Balance Volume (OBV): The OBV has been fluctuating, indicating indecision among investors.
- Chaikin Money Flow (CMF): The CMF has been negative, suggesting selling pressure.
- Conclusion: The volume indicators reflect indecisiveness among investors with a slight bias towards selling pressure.
Overall Conclusion:
Based on the analysis of the technical indicators, the next few days for EFXT are likely to see a potential reversal in the stock price. The trend indicators point towards a bearish outlook, while the momentum indicators indicate a bearish sentiment with a possibility of a reversal. The volatility indicators suggest a potential reversal due to oversold conditions, and the volume indicators reflect indecisiveness with a slight bias towards selling pressure.
Recommendation:
Considering the overall analysis, it is advisable to exercise caution in trading EFXT in the next few days. Traders should closely monitor the price action for signs of a reversal and wait for confirmation before taking any significant positions. It is essential to consider risk management strategies and set stop-loss levels to mitigate potential losses in case the reversal does not materialize as expected.