Technical Analysis of EDN 2024-05-10
Overview:
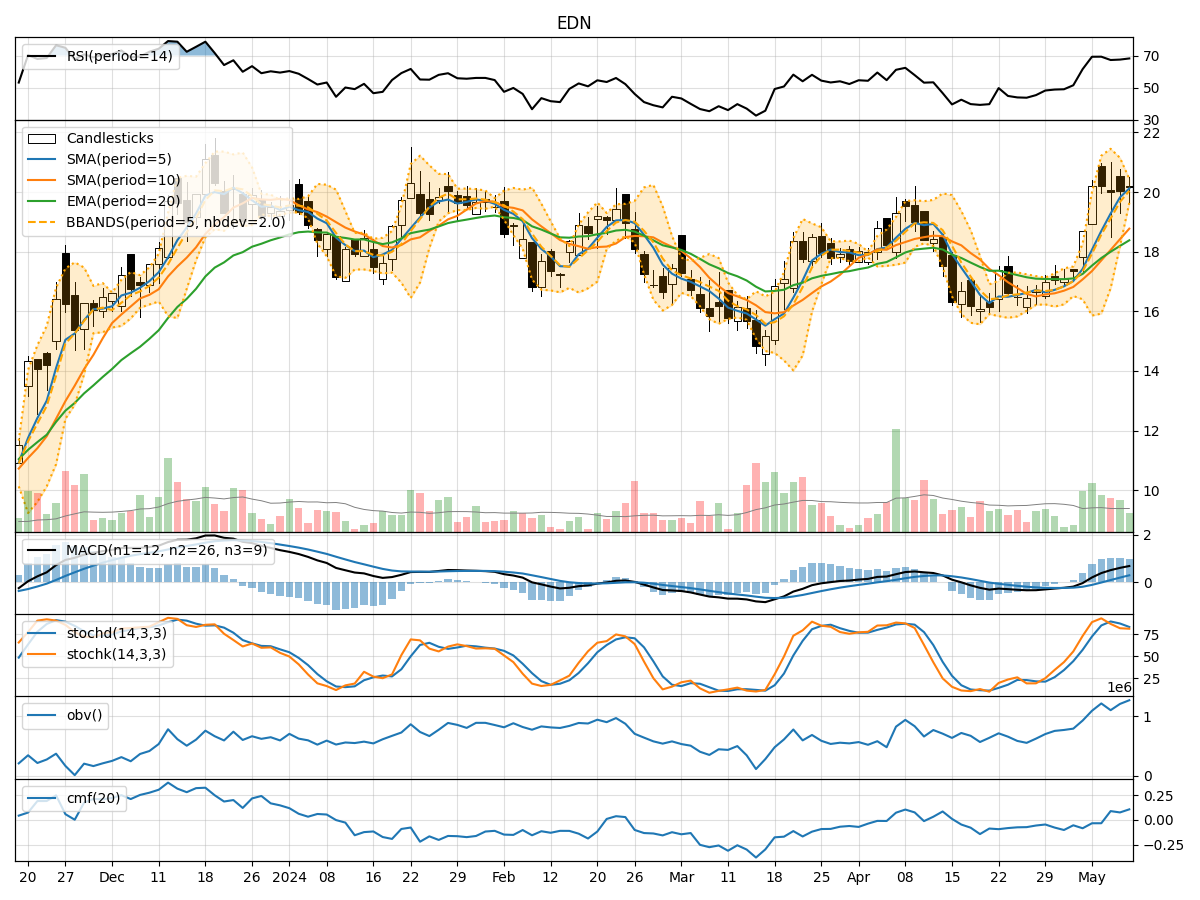
In analyzing the technical indicators for EDN over the last 5 days, we will delve into the trend, momentum, volatility, and volume indicators to provide a comprehensive outlook on the possible stock price movement. By examining these key factors, we aim to offer valuable insights and predictions for the upcoming trading days.
Trend Analysis:
- Moving Averages (MA): The 5-day Moving Average (MA) has been consistently rising, indicating a bullish trend in the short term.
- MACD: The MACD line has been above the signal line, suggesting positive momentum in the stock price.
- RSI: The Relative Strength Index (RSI) has been hovering around 70, indicating a slightly overbought condition but still within a bullish territory.
Momentum Analysis:
- Stochastic Oscillator: The Stochastic Oscillator shows the stock is in the overbought zone, potentially signaling a reversal or a period of consolidation.
- Williams %R: The Williams %R is also in the overbought region, suggesting a possible pullback in the stock price.
Volatility Analysis:
- Bollinger Bands (BB): The Bollinger Bands have been widening, indicating increased volatility in the stock price.
- BB %B: The %B indicator is above 0.5, suggesting the stock is trading above the middle band and potentially in an uptrend.
Volume Analysis:
- On-Balance Volume (OBV): The OBV has been showing positive accumulation, indicating buying pressure in the stock.
- Chaikin Money Flow (CMF): The CMF is positive, suggesting money flow into the stock over the past 20 days.
Conclusion:
Based on the technical indicators and analysis: - Trend: The stock is in an upward trend supported by rising moving averages and a positive MACD. - Momentum: The momentum indicators suggest the stock is overbought, indicating a potential pullback or consolidation. - Volatility: The widening Bollinger Bands imply increased volatility, which could lead to sharp price movements. - Volume: The positive OBV and CMF indicate buying pressure and positive money flow into the stock.
Forecast:
Considering the overall bullish trend but overbought momentum indicators, we anticipate a short-term pullback or consolidation in the stock price. Traders may consider taking profits or waiting for a better entry point. However, the positive volume indicators suggest that any pullback could be temporary, and the overall uptrend may resume after a period of consolidation.
Recommendation:
- Short-term: Consider taking profits or tightening stop-loss levels due to overbought conditions.
- Long-term: The overall bullish trend remains intact, so investors can hold onto their positions with a focus on potential buying opportunities during pullbacks.
By combining technical analysis with market dynamics, this assessment aims to provide a well-rounded perspective on the possible stock price movement for EDN in the upcoming trading days.