Technical Analysis of ECO 2024-05-10
Overview:
In analyzing the technical indicators for ECO stock over the last 5 days, we will delve into the trends, momentum, volatility, and volume indicators to provide a comprehensive outlook on the possible stock price movement in the coming days. By examining these key aspects, we aim to offer valuable insights and predictions to guide your investment decisions.
Trend Analysis:
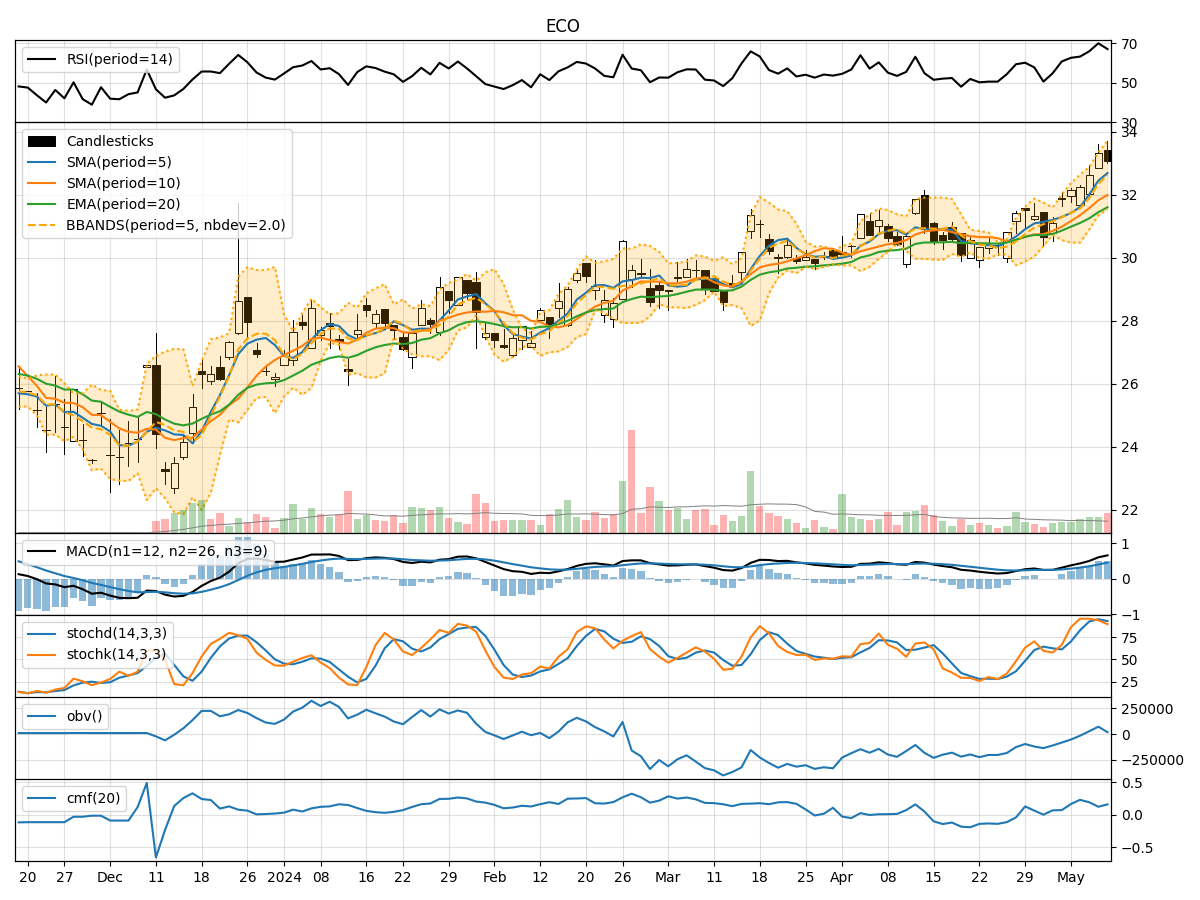
- Moving Averages (MA): The 5-day Moving Average (MA) has been consistently above the Simple Moving Average (SMA) and Exponential Moving Average (EMA), indicating a bullish trend.
- MACD: The Moving Average Convergence Divergence (MACD) has shown positive values, with the MACD line consistently above the Signal line, suggesting upward momentum.
Momentum Analysis:
- RSI: The Relative Strength Index (RSI) has been in the overbought territory, indicating a strong bullish momentum.
- Stochastic Oscillator: Both %K and %D have been in the overbought zone, signaling a potential reversal or consolidation.
Volatility Analysis:
- Bollinger Bands (BB): The stock price has mostly remained within the Bollinger Bands, with the %B indicator showing fluctuations but staying within the bands.
Volume Analysis:
- On-Balance Volume (OBV): The OBV has shown mixed signals, with some days experiencing selling pressure and others showing buying interest.
- Chaikin Money Flow (CMF): The CMF has been positive, indicating accumulation by investors.
Key Observations:
- The stock has been on an upward trend, supported by positive MACD and RSI readings.
- However, the overbought conditions in RSI and Stochastic indicators suggest a potential pullback or consolidation.
- Volatility has been relatively stable, with the stock price mostly trading within the Bollinger Bands.
- The volume indicators show a mix of buying and selling pressure, reflecting indecision among market participants.
Conclusion:
Based on the analysis of the technical indicators, the stock is likely to experience a short-term pullback or consolidation in the coming days. The overbought conditions in RSI and Stochastic indicators suggest a potential reversal in the bullish momentum. Investors should exercise caution and consider taking profits or waiting for a better entry point before initiating new positions. Overall, the outlook is slightly bearish in the short term.