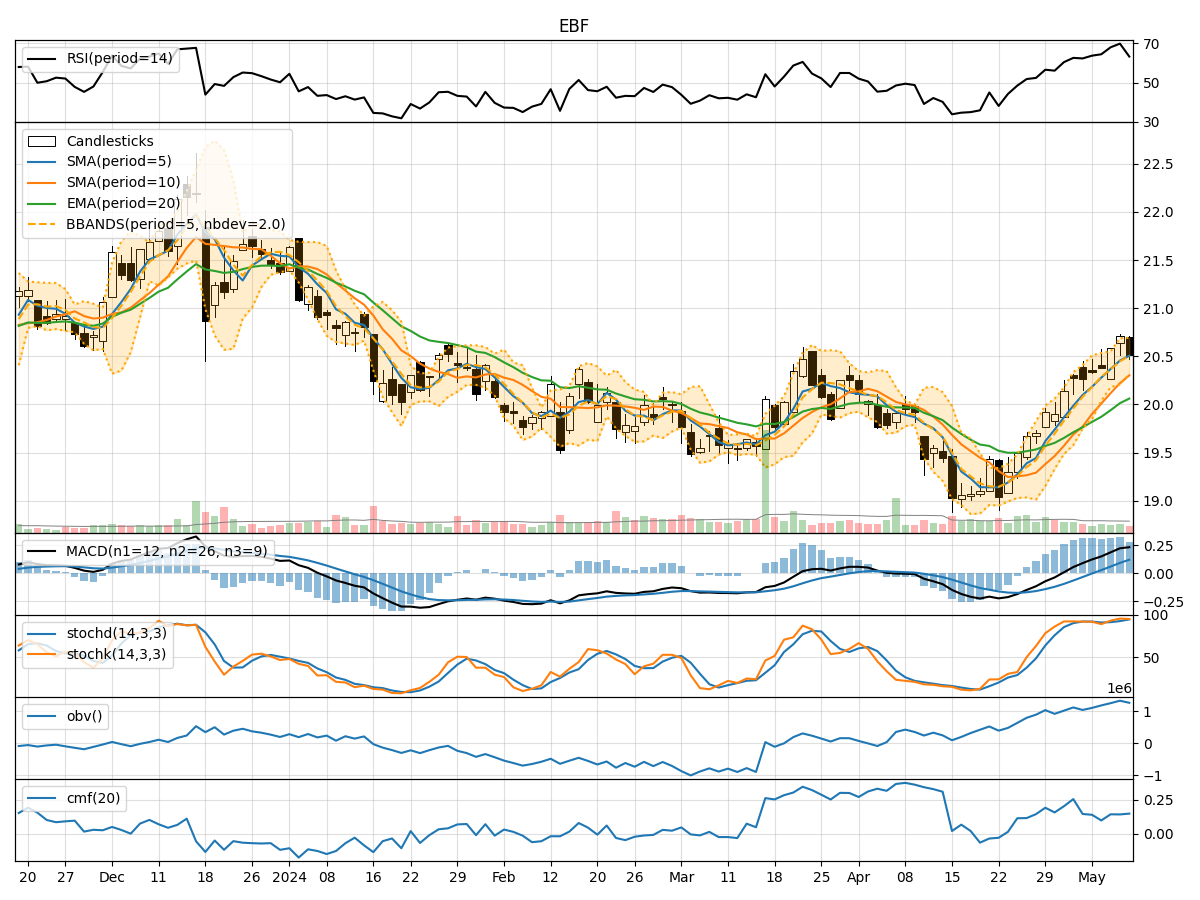
Technical Analysis of EBF 2024-05-31
Overview:
In analyzing the technical indicators for EBF stock over the last 5 days, we will delve into the trend, momentum, volatility, and volume indicators to provide a comprehensive outlook on the possible future stock price movement. By examining these key indicators, we aim to offer valuable insights and predictions for the upcoming trading days.
Trend Indicators:
- Moving Averages (MA): The 5-day Moving Average (MA) has been fluctuating around the closing prices, indicating short-term price trends. The Simple Moving Average (SMA) and Exponential Moving Average (EMA) have shown a slight upward trend, suggesting a potential bullish sentiment.
- MACD: The Moving Average Convergence Divergence (MACD) has been positive but with a decreasing trend, indicating a possible weakening of the bullish momentum.
- Conclusion: The trend indicators suggest a slightly bullish sentiment in the short term, but with signs of potential weakness in the bullish momentum.
Momentum Indicators:
- RSI: The Relative Strength Index (RSI) has been fluctuating but generally staying above the oversold threshold of 30, indicating a bullish momentum.
- Stochastic Oscillator: Both %K and %D have shown a mix of bullish and bearish signals, suggesting a neutral momentum.
- Conclusion: The momentum indicators present a mixed outlook, with RSI indicating bullish momentum while the Stochastic Oscillator signals neutrality.
Volatility Indicators:
- Bollinger Bands (BB): The Bollinger Bands have shown price fluctuations within the bands, indicating moderate volatility.
- Conclusion: Volatility indicators suggest moderate price fluctuations within a certain range, without extreme volatility.
Volume Indicators:
- On-Balance Volume (OBV): The OBV has shown fluctuations but with a slight increase, indicating potential buying pressure.
- Chaikin Money Flow (CMF): The CMF has been negative, suggesting potential selling pressure.
- Conclusion: Volume indicators present a mixed picture, with OBV indicating buying pressure while CMF signals selling pressure.
Overall Conclusion:
Based on the analysis of the technical indicators, the next few days' possible stock price movement for EBF stock is likely to be sideways with a slightly bullish bias. The trend indicators suggest a short-term bullish sentiment, supported by moving averages, while momentum indicators show a mix of bullish and neutral signals. Volatility indicators point towards moderate price fluctuations, and volume indicators indicate a balance between buying and selling pressures.
Recommendation:
Considering the overall analysis, it is advisable to monitor the stock closely for any shifts in momentum or trend. Traders may consider short-term bullish positions with proper risk management strategies in place. However, it is essential to remain cautious due to the mixed signals from momentum and volume indicators. Additionally, keeping an eye on key support and resistance levels can help in making informed trading decisions.