Technical Analysis of E 2024-05-10
Overview:
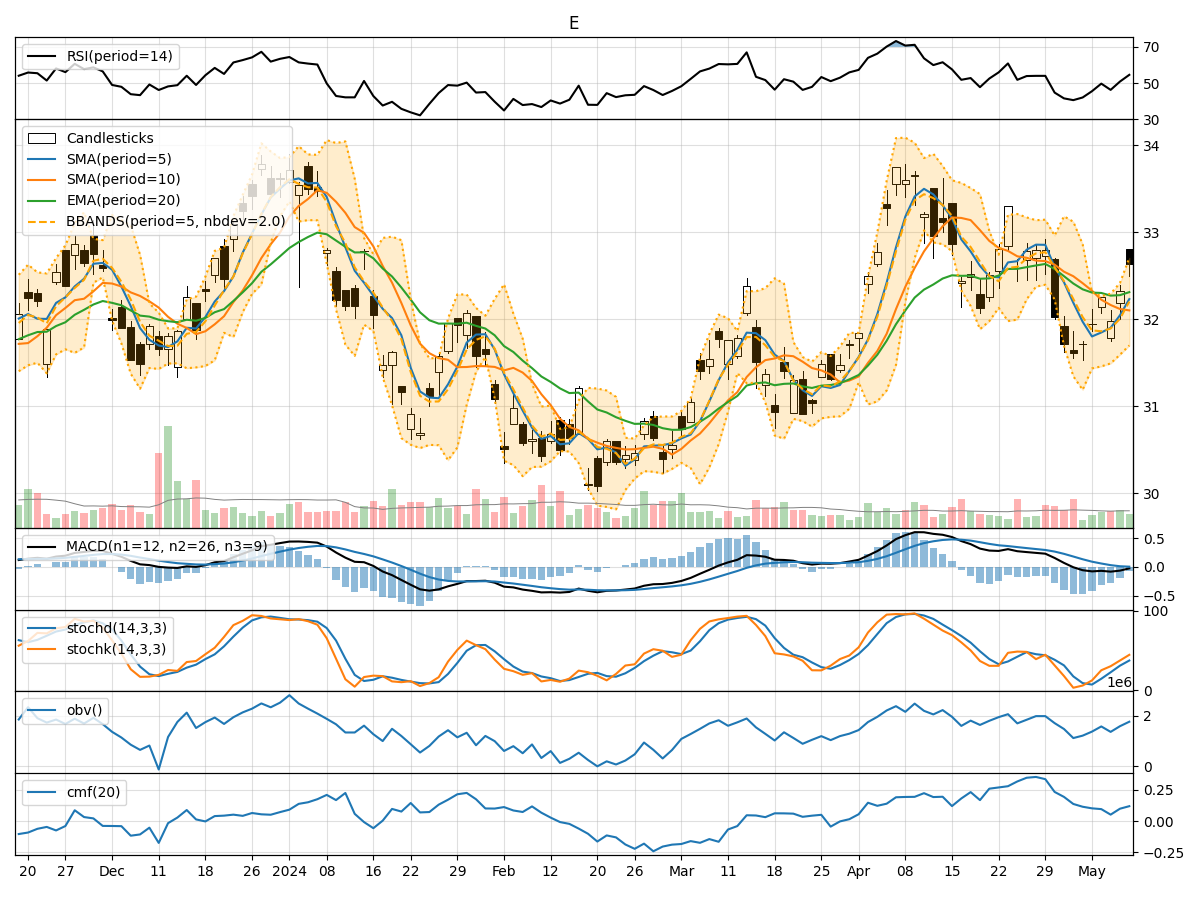
In analyzing the technical indicators for the last 5 days, we will delve into the trends, momentum, volatility, and volume of the stock to determine the possible future price movement. By examining key indicators such as moving averages, MACD, RSI, Bollinger Bands, and OBV, we aim to provide a comprehensive forecast for the upcoming days.
Trend Analysis:
- Moving Averages (MA): The 5-day MA has been fluctuating around the closing prices, indicating short-term price trends. The stock has been trading below the 10-day SMA, suggesting a potential bearish sentiment.
- MACD: The MACD line has been consistently negative, with the MACD histogram showing a decreasing trend. This indicates a bearish momentum in the stock price.
- EMA: The EMA has been declining slightly, reflecting a weakening trend in the stock price.
Momentum Analysis:
- RSI: The RSI has been hovering around the 50 level, indicating a neutral momentum in the stock. There is no clear overbought or oversold signal.
- Stochastic Oscillator: Both %K and %D lines of the Stochastic Oscillator have been rising, suggesting a potential bullish momentum in the stock.
- Williams %R: The Williams %R is currently in the oversold territory, indicating a possible buying opportunity.
Volatility Analysis:
- Bollinger Bands (BB): The stock price has been trading within the Bollinger Bands, with the bands narrowing slightly. This suggests a period of consolidation and decreased volatility.
- Bollinger Band %B: The %B indicator is below 1, indicating that the stock price is trading below the lower Bollinger Band, potentially signaling an oversold condition.
Volume Analysis:
- On-Balance Volume (OBV): The OBV has been fluctuating, indicating a mixed sentiment among investors regarding the stock.
- Chaikin Money Flow (CMF): The CMF has been positive, suggesting that money is flowing into the stock over the past 20 days.
Conclusion:
Based on the technical indicators analyzed: - Trend: The stock is currently in a bearish trend, as indicated by the moving averages and MACD. - Momentum: The momentum is neutral to slightly bullish, with the Stochastic Oscillator showing potential for a bullish reversal. - Volatility: The stock is experiencing a period of consolidation with decreased volatility, as shown by the Bollinger Bands. - Volume: The volume indicators suggest a mixed sentiment among investors, with no clear direction.
Forecast:
Considering the overall analysis, the next few days may see the stock price continue in a sideways consolidation pattern with a potential for a bullish reversal in momentum. Traders should closely monitor the Stochastic Oscillator for confirmation of a bullish trend. It is advisable to wait for a clear signal before making any significant trading decisions.