Technical Analysis of DVN 2024-05-10
Overview:
In analyzing the technical indicators for DVN over the last 5 days, we will delve into the trend, momentum, volatility, and volume indicators to provide a comprehensive assessment of the stock's potential price movement. By examining these key factors, we aim to offer valuable insights and predictions for the next few days.
Trend Analysis:
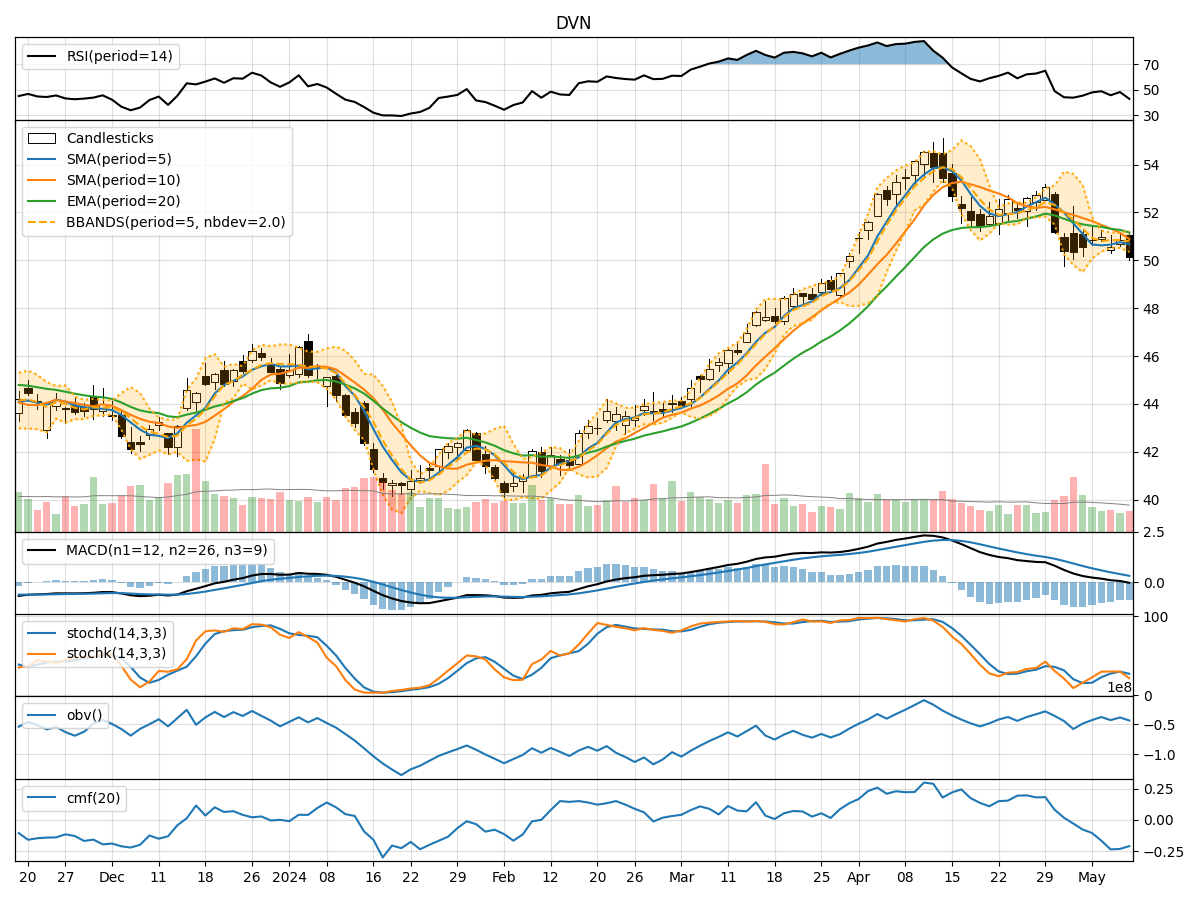
- Moving Averages (MA): The 5-day MA has been fluctuating around the closing prices, indicating short-term price trends. The SMA(10) and EMA(20) have been gradually declining, suggesting a bearish sentiment.
- MACD: The MACD line has been consistently below the signal line, indicating a bearish trend. The MACD histogram has been decreasing, further supporting a downward momentum.
Momentum Analysis:
- RSI: The RSI has been hovering around the mid-range, indicating a lack of strong momentum in either direction.
- Stochastic Oscillator: Both %K and %D have been relatively low, suggesting a potential oversold condition.
- Williams %R: The Williams %R has been in the oversold territory, indicating a possible reversal in the short term.
Volatility Analysis:
- Bollinger Bands (BB): The stock price has been trading within the bands, with the lower band providing support. The narrowing of the bands suggests decreasing volatility.
- Bollinger %B: The %B indicator has been close to 0.5, indicating a neutral position within the bands.
Volume Analysis:
- On-Balance Volume (OBV): The OBV has been fluctuating, indicating mixed buying and selling pressure.
- Chaikin Money Flow (CMF): The CMF has been negative, suggesting a net outflow of money from the stock.
Key Observations:
- The trend indicators point towards a bearish sentiment, with moving averages and MACD signaling a potential downward movement.
- Momentum indicators show a lack of strong momentum, but the oversold conditions in stochastic and Williams %R suggest a possible reversal.
- Volatility has been decreasing, indicating a period of consolidation and potential price stability.
- Volume indicators reflect mixed sentiment, with no clear accumulation or distribution pattern.
Conclusion:
Based on the analysis of technical indicators, the stock price of DVN is likely to experience further downward movement in the next few days. The bearish trend indicated by moving averages and MACD, coupled with the lack of strong momentum, suggests a continuation of the current downtrend. Traders should exercise caution and consider short-term selling opportunities until a clear reversal signal is observed.