Technical Analysis of DUK 2024-05-10
Overview:
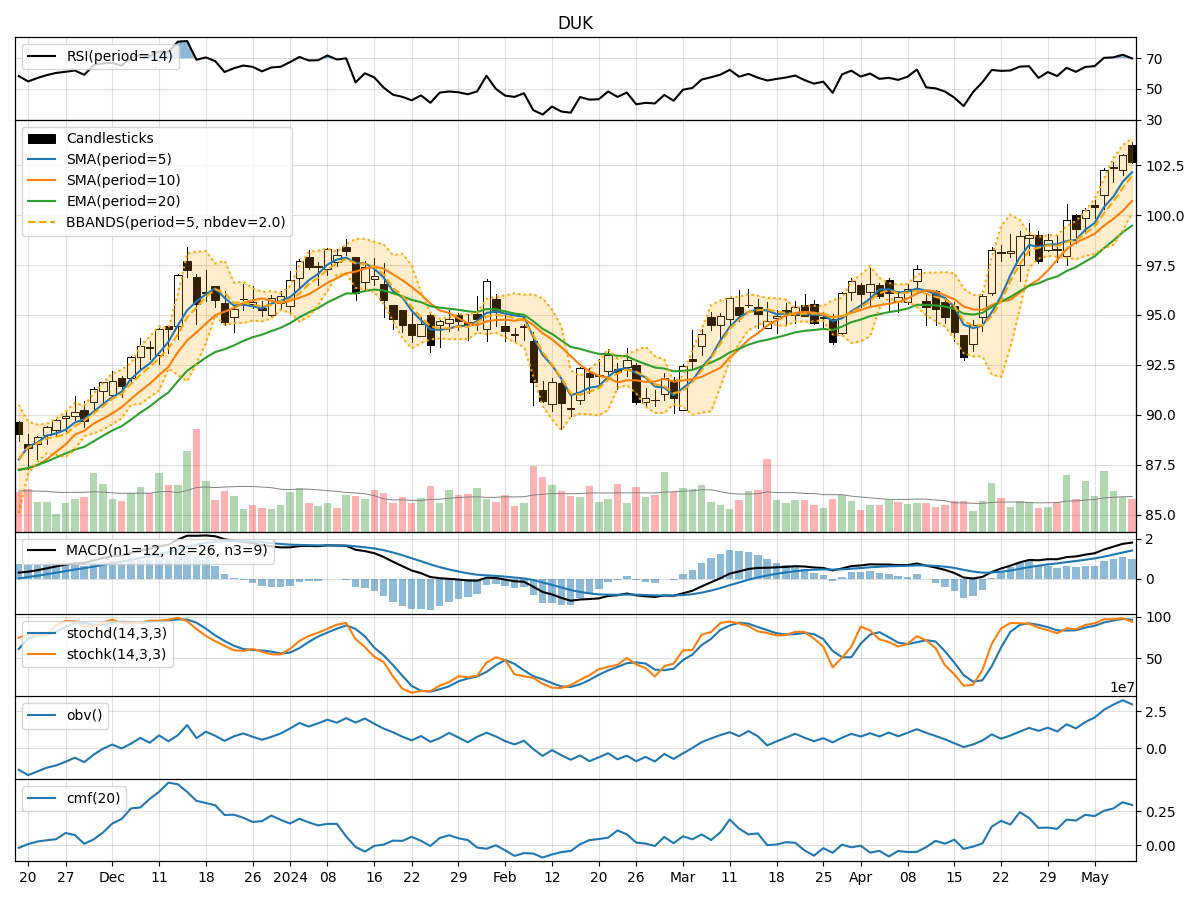
In analyzing the technical indicators for DUK over the last 5 days, we will delve into the trend, momentum, volatility, and volume indicators to provide a comprehensive outlook on the possible stock price movement in the coming days.
Trend Analysis:
- Moving Averages (MA): The 5-day Moving Average has been consistently above the Simple Moving Average (SMA) and Exponential Moving Average (EMA), indicating a bullish trend.
- MACD: The MACD line has been above the signal line, with both lines showing an upward trend, suggesting bullish momentum.
- RSI: The Relative Strength Index has been in the overbought territory, indicating a strong bullish momentum.
Momentum Analysis:
- Stochastic Oscillator: Both %K and %D lines have been in the overbought zone, suggesting a potential reversal or consolidation.
- Williams %R: The Williams %R indicator has been in the oversold region, indicating a potential reversal to the upside.
Volatility Analysis:
- Bollinger Bands: The stock price has been trading within the upper Bollinger Band, indicating an overbought condition.
- Bollinger %B: The %B indicator has been above 0.8, suggesting a potential reversal or pullback.
Volume Analysis:
- On-Balance Volume (OBV): The OBV indicator has been showing an increasing trend, indicating accumulation by investors.
- Chaikin Money Flow (CMF): The CMF has been positive, suggesting buying pressure in the stock.
Conclusion:
Based on the analysis of the technical indicators, the stock of DUK is currently in an overbought condition with strong bullish momentum. However, the Stochastic Oscillator and Williams %R indicators suggest a potential reversal or consolidation in the near term. The Bollinger Bands also indicate an overbought condition, further supporting the possibility of a pullback.
Recommendation:
Considering the overbought condition and potential reversal signals from the momentum and volatility indicators, it is advisable to exercise caution in entering new long positions at the current price levels. Traders may consider taking profits on existing positions or implementing risk management strategies to protect gains. A short-term correction or consolidation phase could be expected in the coming days.
Key Takeaways:
- Upward Trend: The stock has been in a strong bullish trend.
- Overbought Condition: Indicates a potential reversal or pullback.
- Mixed Signals: Momentum and volatility indicators suggest caution.
- Risk Management: Implement strategies to protect gains in the current market environment.
As a leading technical analyst, it is crucial to stay vigilant and adapt to changing market dynamics to make informed decisions and navigate potential risks effectively.