Technical Analysis of DSX 2024-05-10
Overview:
In analyzing the technical indicators for DSX over the last 5 days, we will delve into the trend, momentum, volatility, and volume indicators to provide a comprehensive outlook on the possible stock price movement. By examining these key factors, we aim to offer valuable insights and predictions for the upcoming days.
Trend Analysis:
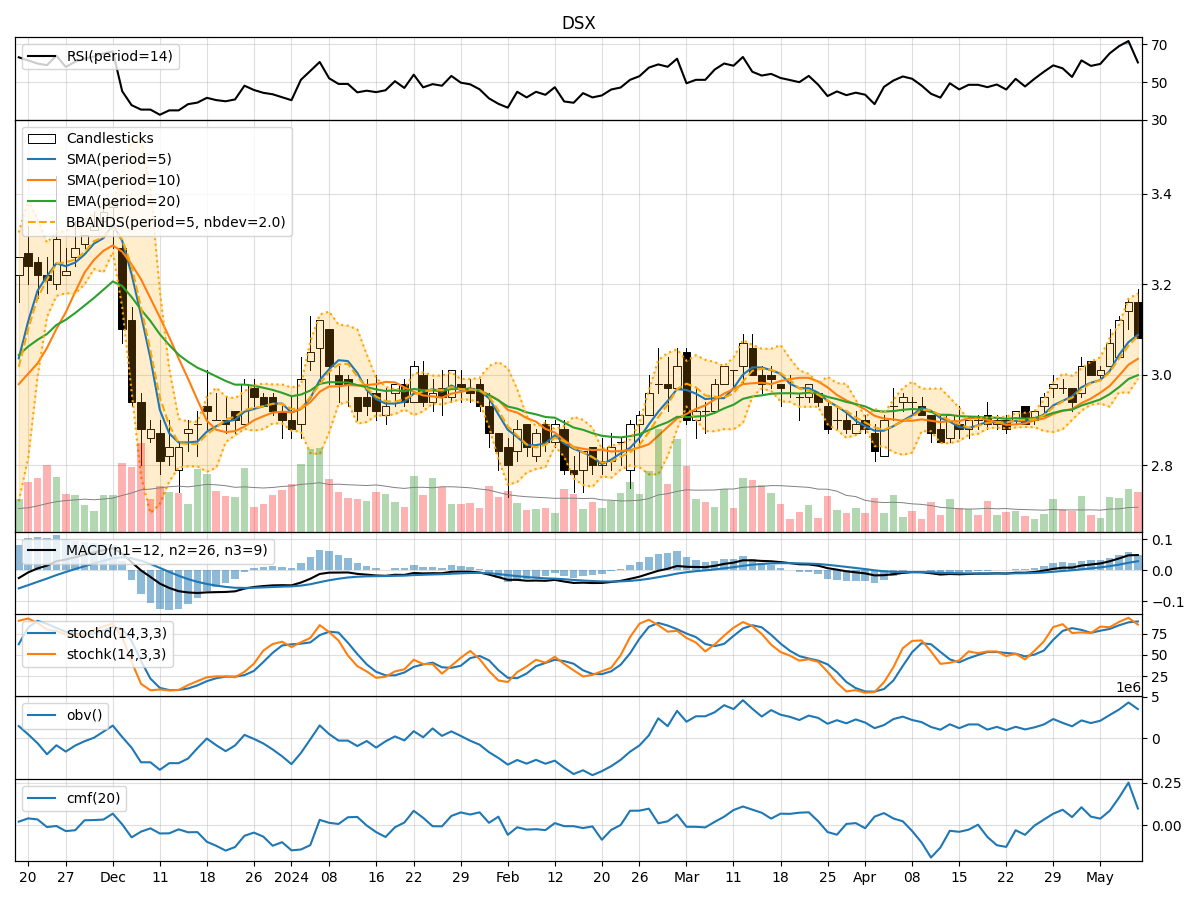
- Moving Averages (MA): The 5-day Moving Average (MA) has been consistently above the Simple Moving Average (SMA) and Exponential Moving Average (EMA), indicating a bullish trend.
- MACD: The Moving Average Convergence Divergence (MACD) has shown positive values, with the MACD line consistently above the Signal line, suggesting upward momentum.
Momentum Analysis:
- RSI: The Relative Strength Index (RSI) has been in the overbought territory, indicating a strong bullish momentum.
- Stochastic Oscillator: Both %K and %D have been in the overbought zone, signaling a strong buying pressure.
Volatility Analysis:
- Bollinger Bands (BB): The Bollinger Bands have shown an expanding pattern, indicating increased volatility in the stock price.
Volume Analysis:
- On-Balance Volume (OBV): The OBV has been steadily increasing, reflecting strong buying interest in the stock.
- Chaikin Money Flow (CMF): The CMF has been positive, suggesting that money is flowing into the stock.
Key Observations:
- The trend indicators suggest a bullish sentiment, supported by the moving averages and MACD.
- Momentum indicators like RSI and Stochastic Oscillator point towards a strong buying momentum.
- Volatility has increased, as indicated by the expanding Bollinger Bands.
- Volume indicators show a consistent rise in buying pressure, as seen in OBV and CMF.
Conclusion:
Based on the analysis of the technical indicators, the next few days are likely to see continued upward movement in the stock price of DSX. The bullish trend, strong momentum, increasing buying pressure, and expanding volatility all point towards a favorable outlook for the stock. Traders and investors may consider buying opportunities in DSX based on the current technical signals.