Technical Analysis of DOLE 2024-05-10
Overview:
In analyzing the technical indicators for DOLE stock over the last 5 days, we will delve into the trends, momentum, volatility, and volume indicators to provide a comprehensive outlook on the possible future stock price movement. By examining these key factors, we aim to offer valuable insights and predictions for potential investors.
Trend Analysis:
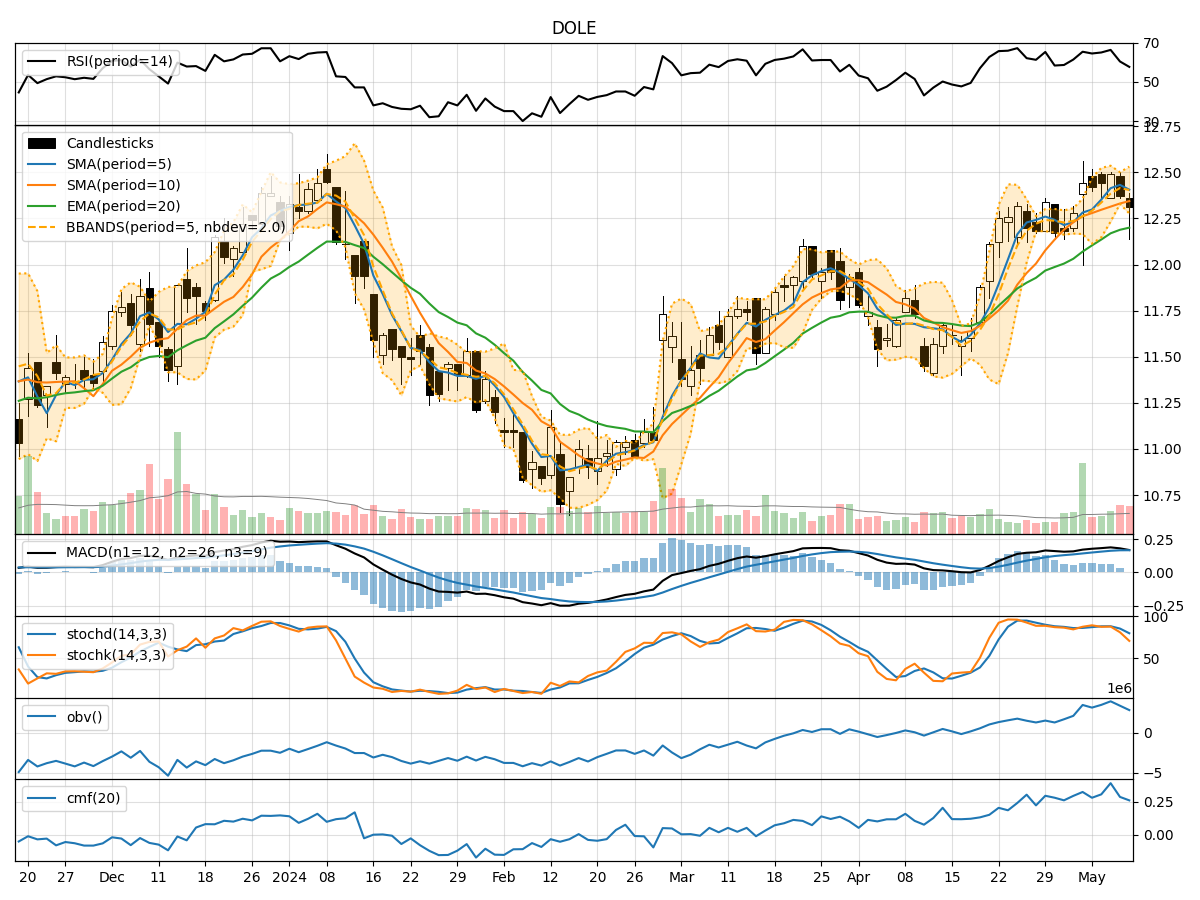
- Moving Averages (MA): The 5-day Moving Average (MA) has been consistently above the Simple Moving Average (SMA) and Exponential Moving Average (EMA), indicating a bullish trend.
- MACD: The MACD line has been above the signal line, with both lines showing an upward trend, suggesting bullish momentum.
- Momentum: The Relative Strength Index (RSI) has been above 50, indicating bullish momentum in the stock price.
Momentum Analysis:
- RSI: The RSI has been above 50, indicating bullish momentum in the stock price.
- Stochastic Oscillator: The Stochastic Oscillator has been in the overbought zone, suggesting a potential reversal in the short term.
- Williams %R: The Williams %R has been in the oversold territory, indicating a potential buying opportunity.
Volatility Analysis:
- Bollinger Bands: The Bollinger Bands have been narrowing, indicating decreasing volatility in the stock price.
- Bollinger %B: The Bollinger %B has been hovering around 0.5, suggesting a neutral stance in terms of volatility.
Volume Analysis:
- On-Balance Volume (OBV): The OBV has shown a slight increase over the last 5 days, indicating accumulation by investors.
- Chaikin Money Flow (CMF): The CMF has been positive, suggesting buying pressure in the stock.
Key Observations:
- The trend indicators suggest a bullish sentiment in the stock price, supported by the moving averages and MACD.
- Momentum indicators show a mixed signal with the RSI indicating bullish momentum, while the Stochastic Oscillator and Williams %R suggest a potential reversal.
- Volatility has been decreasing, indicating a possible period of consolidation or a calm before a potential price movement.
- Volume indicators show a slight increase in accumulation, supported by the positive CMF.
Conclusion:
Based on the analysis of the technical indicators, the overall outlook for DOLE stock in the next few days is bullish. The trend indicators, momentum indicators, and volume indicators collectively suggest a positive sentiment in the stock price. However, caution is advised due to the potential reversal signals from the Stochastic Oscillator and Williams %R. Traders and investors should closely monitor these indicators for any signs of a trend reversal.