Technical Analysis of DNMR 2024-05-31
Overview:
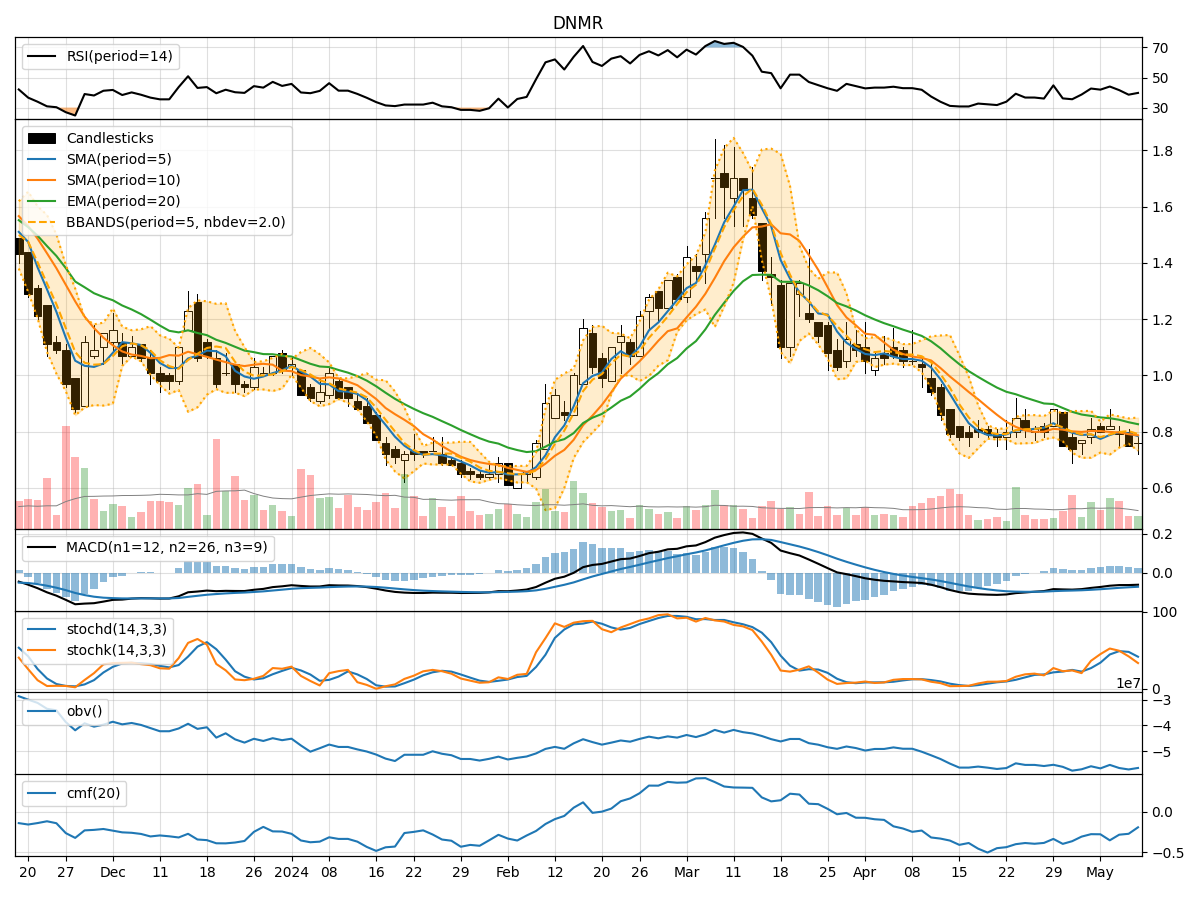
In analyzing the technical indicators for DNMR over the last 5 days, we will delve into the trend, momentum, volatility, and volume indicators to provide a comprehensive outlook on the possible stock price movement in the coming days.
Trend Analysis:
- Moving Averages (MA): The 5-day MA has been consistently below the closing price, indicating a short-term bearish trend.
- MACD: The MACD line has been negative, with the MACD histogram showing slight positive momentum but still below the zero line.
- Conclusion: The trend indicators suggest a bearish sentiment in the short term.
Momentum Analysis:
- RSI: The RSI has been gradually increasing but remains below the overbought threshold, indicating potential room for further upside.
- Stochastic Oscillator: Both %K and %D have been rising, suggesting increasing buying pressure.
- Conclusion: Momentum indicators point towards a potential bullish momentum building up.
Volatility Analysis:
- Bollinger Bands (BB): The stock price has been trading within the bands, with the bands narrowing, indicating decreasing volatility.
- Conclusion: Volatility indicators signal a consolidation phase with reduced price fluctuations.
Volume Analysis:
- On-Balance Volume (OBV): The OBV has been declining, indicating selling pressure outweighing buying pressure.
- Chaikin Money Flow (CMF): The CMF has been negative, reflecting a lack of buying interest.
- Conclusion: Volume indicators suggest a bearish sentiment with more selling pressure.
Overall Conclusion:
Based on the analysis of trend, momentum, volatility, and volume indicators, the following conclusions can be drawn: - Trend: The trend indicators point towards a bearish sentiment in the short term. - Momentum: Momentum indicators suggest a potential bullish momentum building up. - Volatility: Volatility indicators signal a consolidation phase with reduced price fluctuations. - Volume: Volume indicators indicate a bearish sentiment with more selling pressure.
Final Recommendation:
Considering the mixed signals from different indicators, it is crucial to proceed with caution. While momentum indicators hint at a potential bullish momentum, the overall trend and volume indicators lean towards a bearish sentiment. Therefore, it is advisable to exercise caution and closely monitor the stock for further confirmation before making any trading decisions.