Technical Analysis of DHI 2024-05-10
Overview:
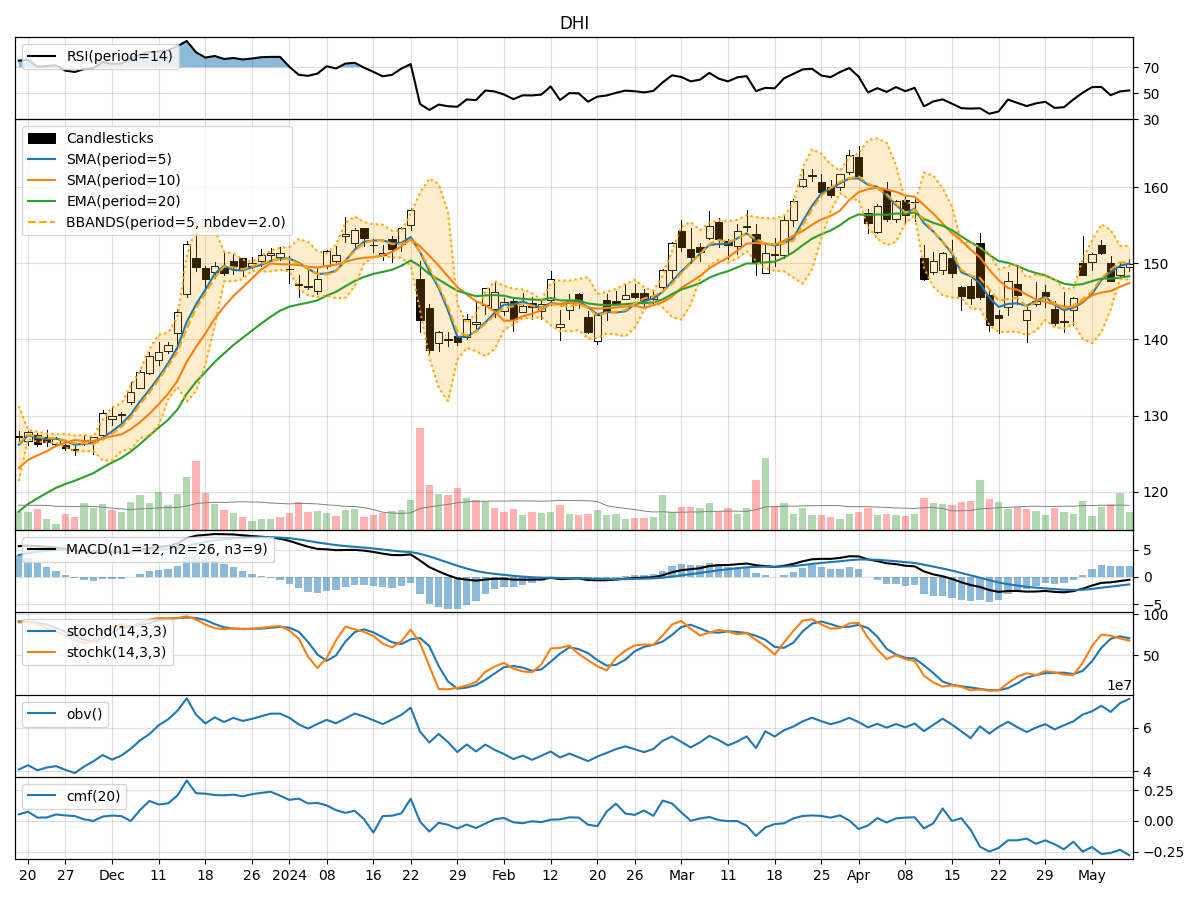
In analyzing the technical indicators for DHI over the last 5 days, we will delve into the trend, momentum, volatility, and volume indicators to provide a comprehensive outlook on the possible stock price movement in the coming days.
Trend Analysis:
- Moving Averages (MA): The 5-day Moving Average has been consistently above the 10-day Simple Moving Average, indicating a short-term bullish trend.
- Exponential Moving Average (EMA): The EMA(20) has shown a slight upward trend, suggesting a positive momentum in the stock price.
- MACD: The MACD line has been consistently above the signal line, indicating a bullish momentum in the stock.
Momentum Analysis:
- RSI: The Relative Strength Index (RSI) has been hovering around the mid-level, indicating a neutral momentum in the stock.
- Stochastic Oscillator: Both %K and %D lines of the Stochastic Oscillator have been fluctuating in the overbought territory, suggesting a potential reversal in the stock price.
- Williams %R: The Williams %R indicator has been fluctuating in the oversold territory, indicating a possible buying opportunity.
Volatility Analysis:
- Bollinger Bands: The Bollinger Bands have been narrowing, suggesting a decrease in volatility and a potential consolidation phase in the stock price.
- Bollinger %B: The %B indicator has been hovering around the mid-level, indicating a balanced market sentiment.
Volume Analysis:
- On-Balance Volume (OBV): The OBV indicator has shown a slight decrease, suggesting a divergence between price and volume, which could signal a potential trend reversal.
- Chaikin Money Flow (CMF): The CMF indicator has been negative, indicating a bearish money flow in the stock.
Conclusion:
Based on the analysis of the technical indicators, the stock of DHI is likely to experience sideways movement in the coming days. The trend indicators suggest a bullish bias in the short term, supported by the moving averages and MACD. However, the momentum indicators show a neutral to bearish sentiment, with the Stochastic Oscillator and Williams %R signaling potential reversals. The volatility indicators point towards a consolidation phase, as indicated by the narrowing Bollinger Bands. The volume indicators, particularly the OBV and CMF, suggest a bearish outlook due to the divergence between price and volume.
Recommendation:
Considering the mixed signals from the technical indicators, it is advisable for investors to exercise caution and closely monitor the stock price movement. Short-term traders may find opportunities within the range-bound market, while long-term investors should wait for more clarity in the trend and momentum before making significant decisions. It is essential to set stop-loss levels and adhere to risk management strategies to navigate the potential volatility in the stock of DHI.