Technical Analysis of DESP 2024-05-10
Overview:
In analyzing the technical indicators for DESP over the last 5 days, we will delve into the trend, momentum, volatility, and volume indicators to provide a comprehensive outlook on the possible stock price movement in the coming days. By examining these key indicators, we aim to offer valuable insights and recommendations for potential investors.
Trend Indicators:
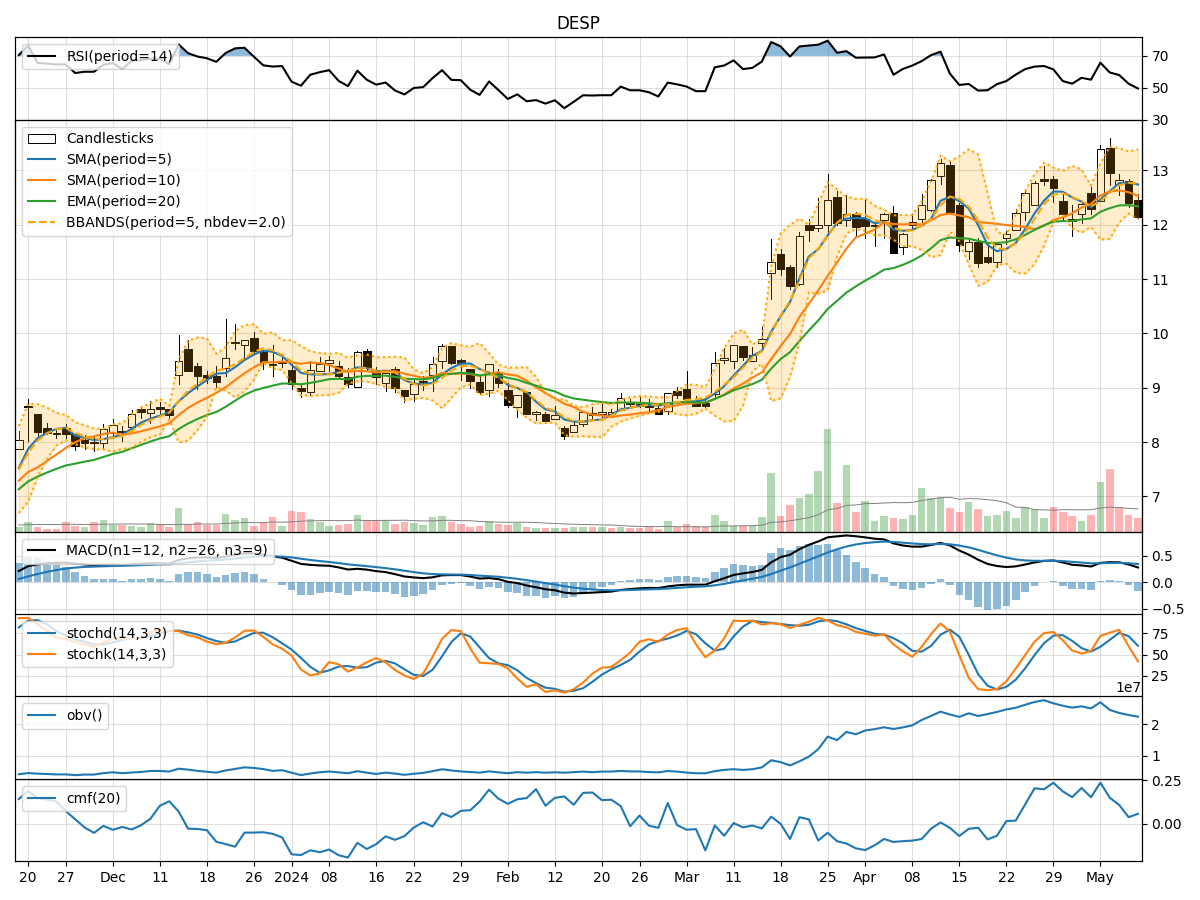
- Moving Averages (MA): The 5-day moving average has been fluctuating around the closing prices, indicating short-term price trends. The Simple Moving Average (SMA) and Exponential Moving Average (EMA) show a slight upward trend, suggesting a potential bullish sentiment.
- MACD: The MACD line has been positive, indicating a bullish momentum. However, the MACD Histogram has been decreasing, signaling a possible weakening of the bullish momentum.
Momentum Indicators:
- RSI: The Relative Strength Index (RSI) has been declining, moving towards the oversold territory, indicating a potential bearish sentiment.
- Stochastic Oscillator: Both %K and %D have been decreasing, suggesting a bearish momentum. The Williams %R is in the oversold region, indicating a potential reversal.
Volatility Indicators:
- Bollinger Bands: The Bollinger Bands have been narrowing, indicating decreasing volatility. The price has been trading within the bands, suggesting a period of consolidation.
- Bollinger %B: The %B indicator is below 0.2, indicating that the stock price is near the lower band, potentially signaling an oversold condition.
Volume Indicators:
- On-Balance Volume (OBV): The OBV has been declining, indicating selling pressure in the stock. This could potentially lead to further downward movement in the stock price.
- Chaikin Money Flow (CMF): The CMF has been decreasing, suggesting that money is flowing out of the stock. This aligns with the bearish sentiment indicated by other indicators.
Conclusion:
Based on the analysis of the technical indicators, the stock of DESP is likely to experience further downward movement in the coming days. The trend indicators show a potential bullish sentiment, but the momentum indicators, especially the RSI and Stochastic Oscillator, point towards a bearish momentum. Additionally, the volatility indicators suggest a period of consolidation with decreasing volatility, while the volume indicators indicate selling pressure and outflow of money from the stock.
Therefore, considering the overall analysis and the current market dynamics, it is advisable to exercise caution and potentially consider short-term selling strategies for DESP in the near future.