Technical Analysis of DELL 2024-05-03
Overview:
In analyzing the technical indicators for DELL over the last 5 days, we will delve into the trend, momentum, volatility, and volume indicators to provide a comprehensive outlook on the possible stock price movement. By examining these key aspects, we aim to offer valuable insights and predictions for the upcoming days.
Trend Analysis:
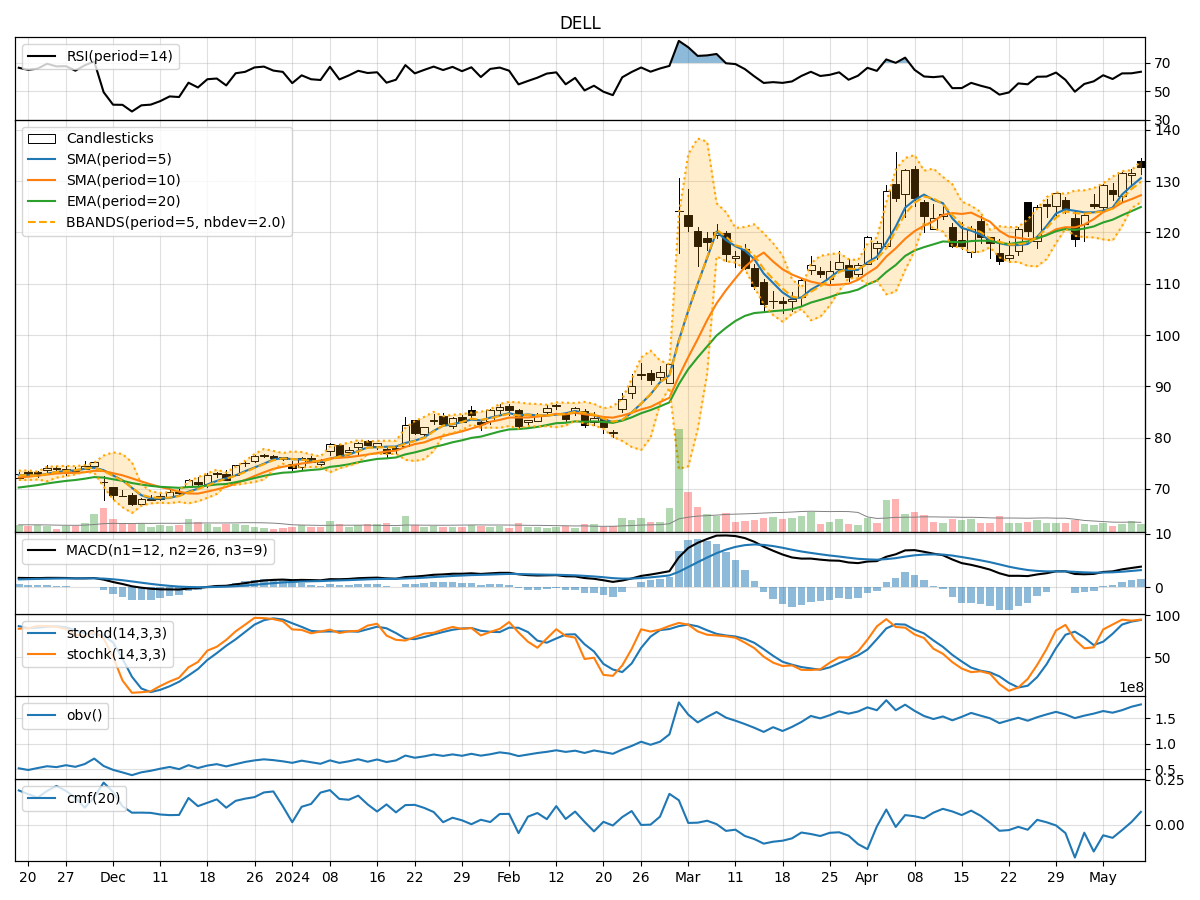
- Moving Averages (MA): The 5-day Moving Average (MA) has been fluctuating around the closing prices, indicating short-term price trends. The Simple Moving Average (SMA) and Exponential Moving Average (EMA) have shown a slight upward trend, suggesting potential bullish momentum.
- MACD: The Moving Average Convergence Divergence (MACD) has been positive but decreasing, indicating a potential slowdown in bullish momentum.
- Conclusion: The trend indicators suggest a potential continuation of the bullish trend in the short term, albeit with some signs of weakening momentum.
Momentum Analysis:
- RSI: The Relative Strength Index (RSI) has been fluctuating around the neutral zone, indicating indecision in the market.
- Stochastic Oscillator: Both %K and %D have shown mixed signals, with %K crossing %D, suggesting a potential reversal.
- Conclusion: The momentum indicators reflect a lack of clear direction in the market, with a possibility of a reversal or consolidation in the near future.
Volatility Analysis:
- Bollinger Bands (BB): The Bollinger Bands have been relatively narrow, indicating low volatility in the stock price.
- Conclusion: The volatility indicators suggest a period of consolidation or sideways movement in the stock price.
Volume Analysis:
- On-Balance Volume (OBV): The OBV has been fluctuating, indicating mixed buying and selling pressure.
- Chaikin Money Flow (CMF): The CMF has been negative, suggesting potential distribution in the stock.
- Conclusion: The volume indicators point towards mixed sentiment in the market, with no clear dominance of buying or selling pressure.
Conclusion:
Based on the analysis of trend, momentum, volatility, and volume indicators, the next few days for DELL stock price movement are likely to be sideways with a potential for a slight bearish bias. The trend indicators hint at a continuation of the bullish trend but with weakening momentum, while the momentum indicators show indecision and a possible reversal. Volatility indicators suggest a period of consolidation, and volume indicators reflect mixed sentiment in the market.
Key Recommendations:
- Monitor Price Action: Keep a close eye on the price action for any signs of a breakout or breakdown from the current consolidation phase.
- Watch for Reversal Signals: Look out for confirmation signals from momentum indicators for a potential reversal in the trend.
- Consider Risk Management: Implement proper risk management strategies to protect against unexpected market movements.
By staying vigilant and interpreting the evolving market dynamics, investors can make informed decisions and navigate the fluctuations in the stock price effectively.