Technical Analysis of DE 2024-05-10
Overview:
In analyzing the technical indicators for DE stock over the last 5 days, we will delve into the trend, momentum, volatility, and volume indicators to provide a comprehensive outlook on the possible stock price movement in the coming days. By examining these key indicators, we aim to offer valuable insights and predictions for potential investors and traders.
Trend Indicators:
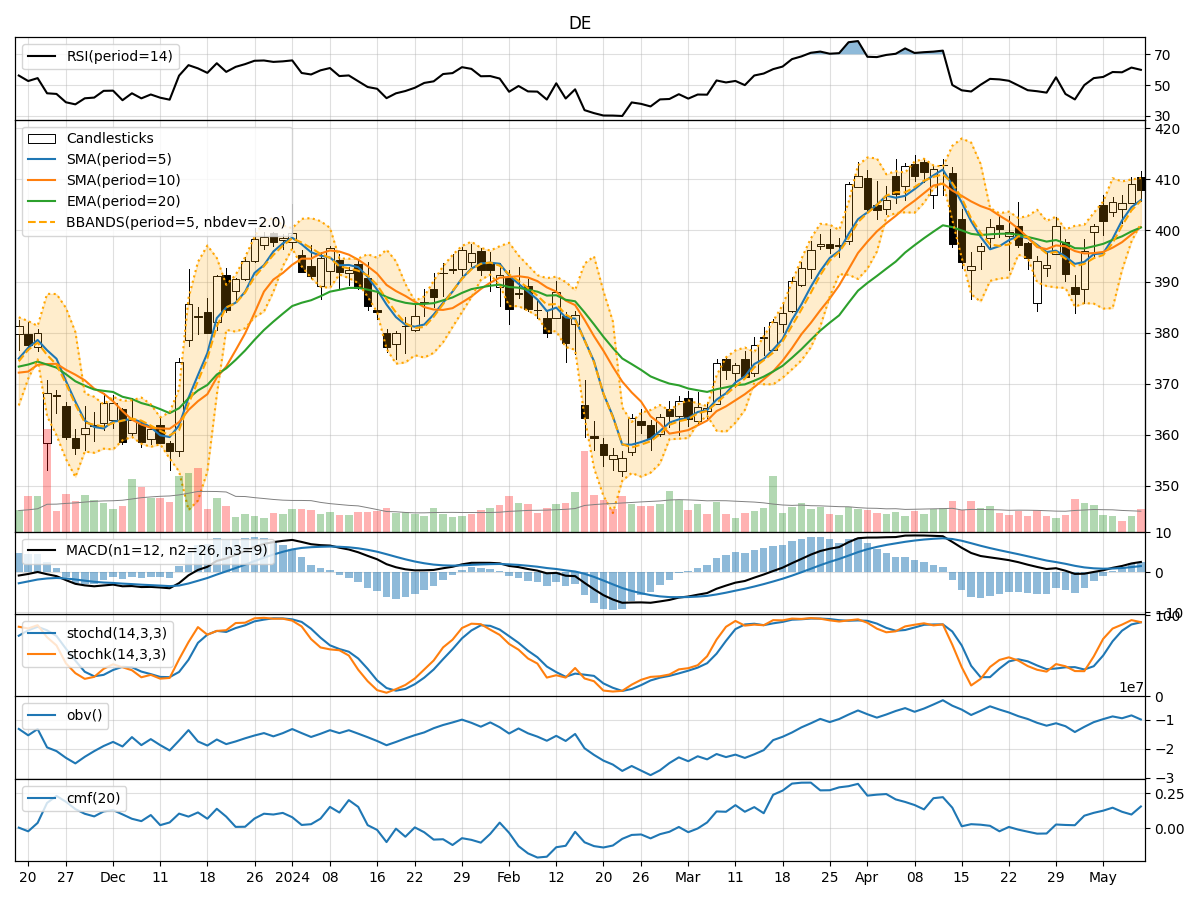
- Moving Averages (MA): The 5-day Moving Average (MA) has been consistently above the Simple Moving Average (SMA) and Exponential Moving Average (EMA), indicating a bullish trend.
- MACD: The MACD line has been consistently above the signal line, suggesting a bullish momentum in the stock price.
- MACD Histogram: The MACD Histogram has been showing an increasing trend, indicating strengthening bullish momentum.
Momentum Indicators:
- RSI: The Relative Strength Index (RSI) has been hovering around the 60-70 range, indicating a neutral to slightly bullish momentum.
- Stochastic Oscillator: Both %K and %D lines of the Stochastic Oscillator have been in the overbought territory, suggesting a potential reversal or consolidation.
- Williams %R: The Williams %R has been fluctuating in the oversold territory, indicating a potential buying opportunity.
Volatility Indicators:
- Bollinger Bands: The stock price has been trading within the Bollinger Bands, with the bands narrowing, suggesting a period of consolidation.
- Bollinger %B: The %B indicator has been hovering around 0.7, indicating a neutral stance in terms of volatility.
Volume Indicators:
- On-Balance Volume (OBV): The OBV has shown mixed signals, with fluctuations in volume accumulation, indicating indecision among market participants.
- Chaikin Money Flow (CMF): The CMF has been positive but relatively flat, suggesting a balanced flow of money into the stock.
Conclusion:
Based on the analysis of the technical indicators, the stock of DE is likely to experience sideways movement in the next few days. The bullish trend indicated by moving averages and MACD may face resistance due to overbought conditions in the Stochastic Oscillator. The volatility indicators suggest a period of consolidation, while volume indicators point towards indecision among investors. Therefore, it is recommended to exercise caution and closely monitor the price action for potential entry or exit points.
Key Takeaways:
- Trend: Upward trend with bullish momentum.
- Momentum: Neutral to slightly bullish momentum.
- Volatility: Consolidation phase with narrowing Bollinger Bands.
- Volume: Mixed signals with indecision among market participants.
Recommendation:
- Stay vigilant for potential reversal signals in the overbought Stochastic Oscillator.
- Monitor price action for a breakout or breakdown from the consolidation phase.
- Consider risk management strategies to navigate uncertain market conditions.
By considering these insights and observations, investors can make informed decisions regarding their positions in DE stock.