Technical Analysis of DB 2024-05-10
Overview:
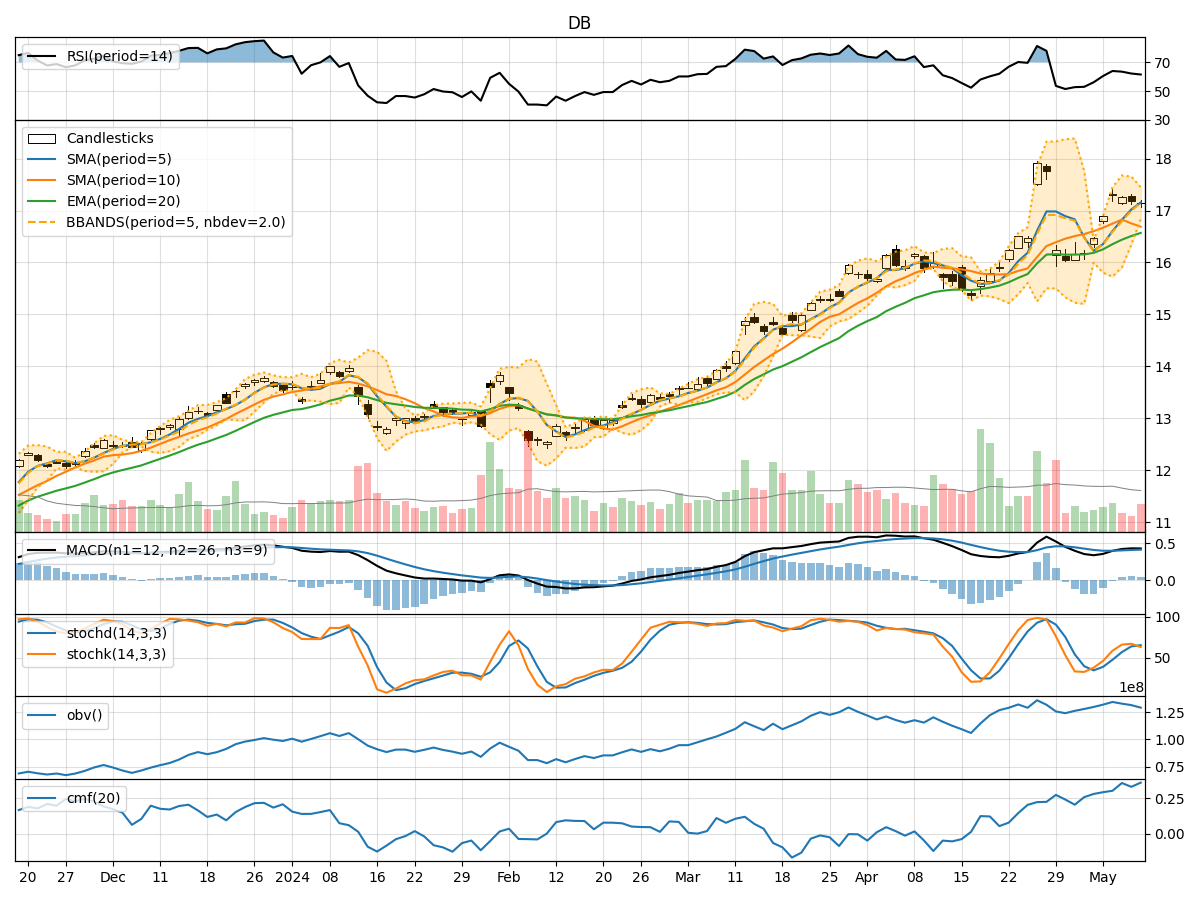
In the last 5 trading days, the stock price of DB has shown a gradual increase, with some fluctuations in between. Various technical indicators have been analyzed to provide insights into the possible future stock price movement. The trend indicators suggest a positive momentum, while momentum indicators show a slight weakening in the bullish sentiment. Volatility indicators indicate a decreasing trend in volatility, and volume indicators show a consistent increase in buying pressure.
Trend Indicators Analysis:
- Moving Averages (MA): The 5-day moving average has been consistently above the closing price, indicating an upward trend.
- MACD: The MACD line has been above the signal line, suggesting a bullish trend.
- EMA: The exponential moving average has been steadily increasing, supporting the bullish sentiment.
Momentum Indicators Analysis:
- RSI: The Relative Strength Index has been in the overbought territory, indicating a strong bullish momentum.
- Stochastic Oscillator: Both %K and %D have been in the overbought zone, suggesting a potential reversal.
- Williams %R: The Williams %R is in the oversold region, indicating a possible reversal in the short term.
Volatility Indicators Analysis:
- Bollinger Bands: The bands have been narrowing, indicating decreasing volatility and a possible consolidation phase.
- Bollinger %B: The %B indicator shows the stock price is currently trading close to the lower band, suggesting a potential bounce back.
Volume Indicators Analysis:
- On-Balance Volume (OBV): The OBV has been steadily increasing, indicating strong buying pressure.
- Chaikin Money Flow (CMF): The CMF has been positive, reflecting a bullish sentiment in the market.
Key Observations:
- The trend indicators suggest a continuation of the bullish trend.
- Momentum indicators show a potential weakening in the bullish momentum.
- Volatility indicators point towards a consolidation phase with decreasing volatility.
- Volume indicators indicate a consistent increase in buying pressure.
Conclusion:
Based on the analysis of the technical indicators, the next few days' possible stock price movement for DB is likely to be sideways with a slight downward bias. The bullish trend may experience a temporary pause or correction due to the overbought conditions indicated by the momentum indicators. However, the overall trend remains positive, supported by the increasing buying pressure shown in the volume indicators. Traders should watch for potential support levels and consider taking profits or adjusting their positions accordingly.