Technical Analysis of DAVA 2024-05-10
Overview:
In analyzing the technical indicators for DAVA over the last 5 days, we will delve into the trend, momentum, volatility, and volume indicators to provide a comprehensive outlook on the possible stock price movement. By examining these key aspects, we aim to offer valuable insights and predictions for the upcoming days.
Trend Indicators:
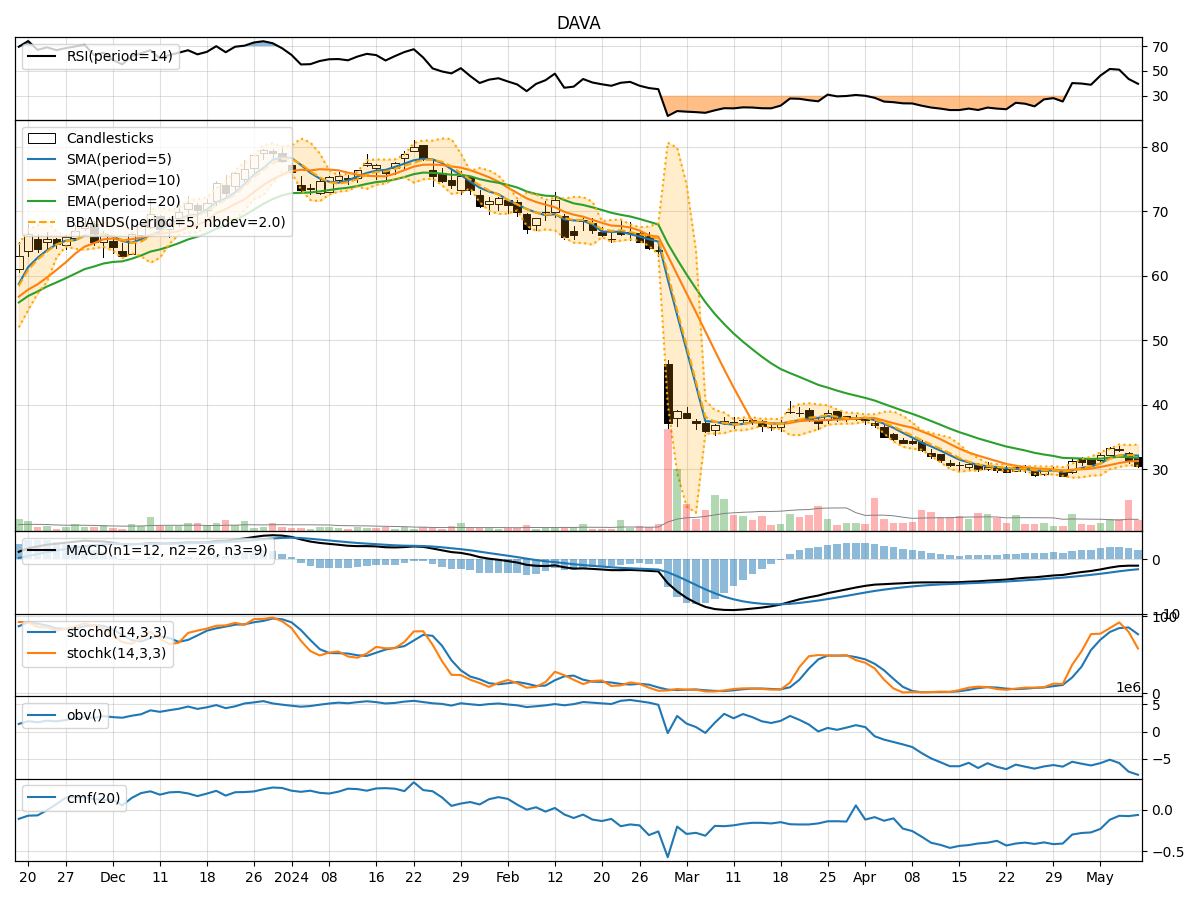
- Moving Averages (MA): The 5-day Moving Average has been consistently above the Simple Moving Average (SMA) and Exponential Moving Average (EMA), indicating a bullish trend.
- MACD: The MACD line has been negative but showing signs of convergence with the signal line, suggesting a potential reversal in the trend.
- MACD Histogram: The MACD Histogram has been decreasing but is approaching the zero line, indicating a possible shift in momentum.
Momentum Indicators:
- RSI: The Relative Strength Index (RSI) has been fluctuating around the midline, indicating indecision in the market.
- Stochastic Oscillator: Both %K and %D have been declining, signaling a bearish momentum.
- Williams %R: The Williams %R is in oversold territory, suggesting a potential reversal in the near term.
Volatility Indicators:
- Bollinger Bands: The stock price has been trading within the Bollinger Bands, with the bands narrowing, indicating reduced volatility.
- Bollinger %B: The %B indicator is below 1, suggesting the stock is trading below the lower band, potentially indicating an oversold condition.
Volume Indicators:
- On-Balance Volume (OBV): The OBV has been consistently declining, indicating selling pressure in the market.
- Chaikin Money Flow (CMF): The CMF has been negative, suggesting outflow of money from the stock.
Key Observations and Opinions:
- Trend: The trend indicators suggest a potential reversal in the bullish trend, with the MACD showing signs of convergence.
- Momentum: The momentum indicators indicate a bearish sentiment, with the Stochastic Oscillator in oversold territory.
- Volatility: Volatility has been decreasing, potentially leading to a period of consolidation.
- Volume: The declining OBV and negative CMF point towards continued selling pressure.
Conclusion:
Based on the analysis of the technical indicators, the stock price of DAVA is likely to experience further downward movement in the coming days. The convergence of the MACD, bearish momentum indicators, and negative volume indicators all point towards a continuation of the current downtrend. Traders and investors should exercise caution and consider short-term selling strategies or wait for a clearer signal of a trend reversal before considering long positions.