Technical Analysis of DAO 2024-05-10
Overview:
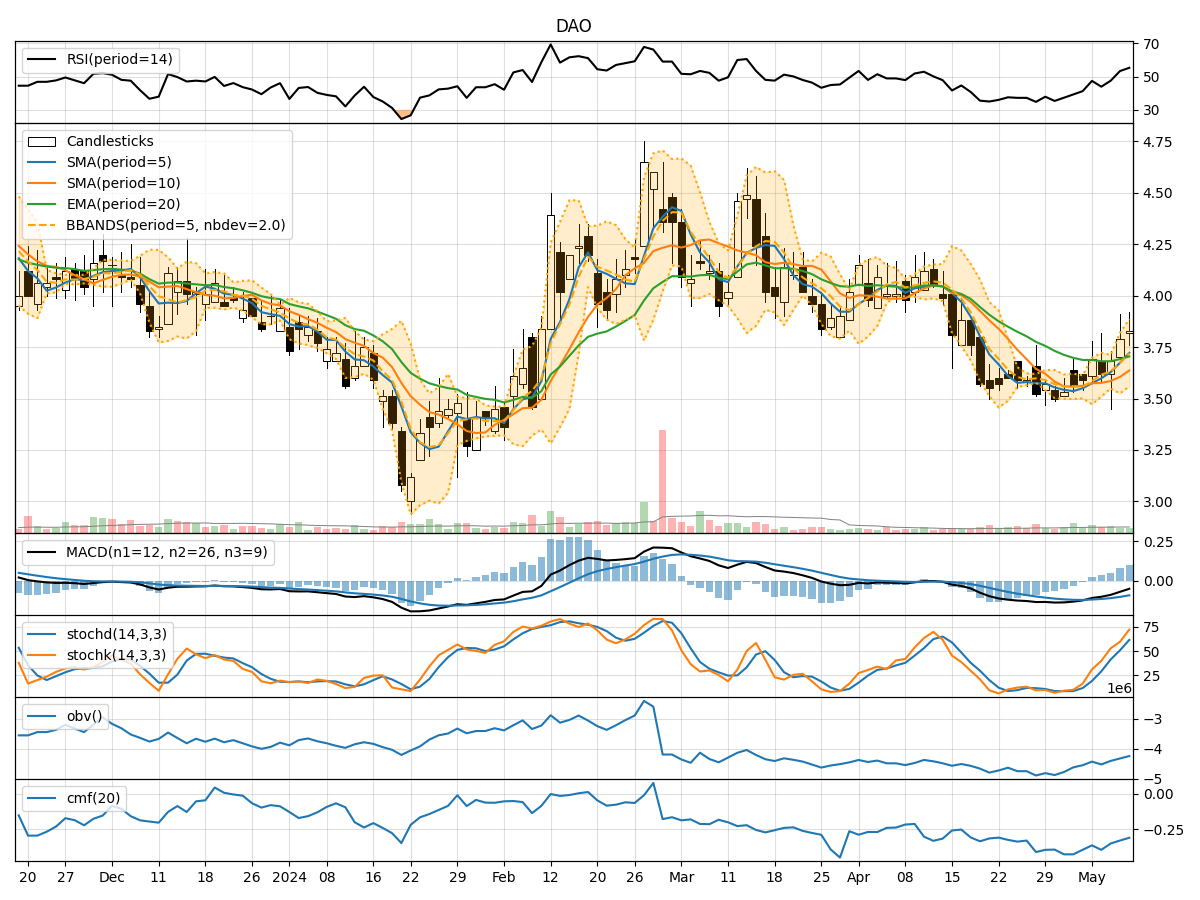
In analyzing the technical indicators for the stock over the last 5 days, we will delve into the trend, momentum, volatility, and volume indicators to provide a comprehensive outlook on the possible stock price movement in the coming days. By examining these key indicators, we aim to offer valuable insights and predictions for potential investors.
Trend Analysis:
- Moving Averages (MA): The 5-day Moving Average (MA) has been showing an upward trend, indicating a positive momentum in the stock price.
- MACD: The Moving Average Convergence Divergence (MACD) has been consistently negative but with a slight improvement over the days, suggesting a potential reversal in the bearish trend.
- EMA: The Exponential Moving Average (EMA) has been relatively stable, reflecting a gradual increase in the stock price.
Momentum Analysis:
- RSI: The Relative Strength Index (RSI) has been increasing, indicating a strengthening momentum in the stock.
- Stochastic Oscillator: Both %K and %D of the Stochastic Oscillator have been rising, signaling a bullish momentum.
- Williams %R: The Williams %R has been decreasing, moving towards oversold territory, which could imply a potential buying opportunity.
Volatility Analysis:
- Bollinger Bands (BB): The Bollinger Bands have been widening, suggesting increased volatility in the stock price.
- Bollinger %B: The %B indicator has been fluctuating within a range, indicating potential price reversals.
- Bollinger Band Width: The Band Width has been expanding, pointing towards heightened price fluctuations.
Volume Analysis:
- On-Balance Volume (OBV): The OBV has been declining, indicating a decrease in buying pressure.
- Chaikin Money Flow (CMF): The CMF has been negative, suggesting a bearish sentiment in the stock.
Key Observations:
- The stock is currently exhibiting mixed signals across different indicators, with some pointing towards a bullish momentum while others indicating a bearish sentiment.
- The increasing RSI and Stochastic Oscillator suggest a potential uptrend in the stock price.
- However, the negative OBV and CMF reflect a lack of strong buying interest in the stock.
Conclusion:
Based on the analysis of the technical indicators, the stock is likely to experience a period of consolidation in the near term. While there are indications of a potential bullish momentum, the overall sentiment remains neutral due to conflicting signals from different indicators. Investors should closely monitor the price action and wait for clearer signals before making any significant trading decisions.