Technical Analysis of DAN 2024-05-31
Overview:
In analyzing the technical indicators for DAN over the last 5 days, we will delve into the trend, momentum, volatility, and volume indicators to provide a comprehensive assessment of the stock's potential price movement. By examining these key factors, we aim to offer valuable insights and predictions for the next few days.
Trend Indicators:
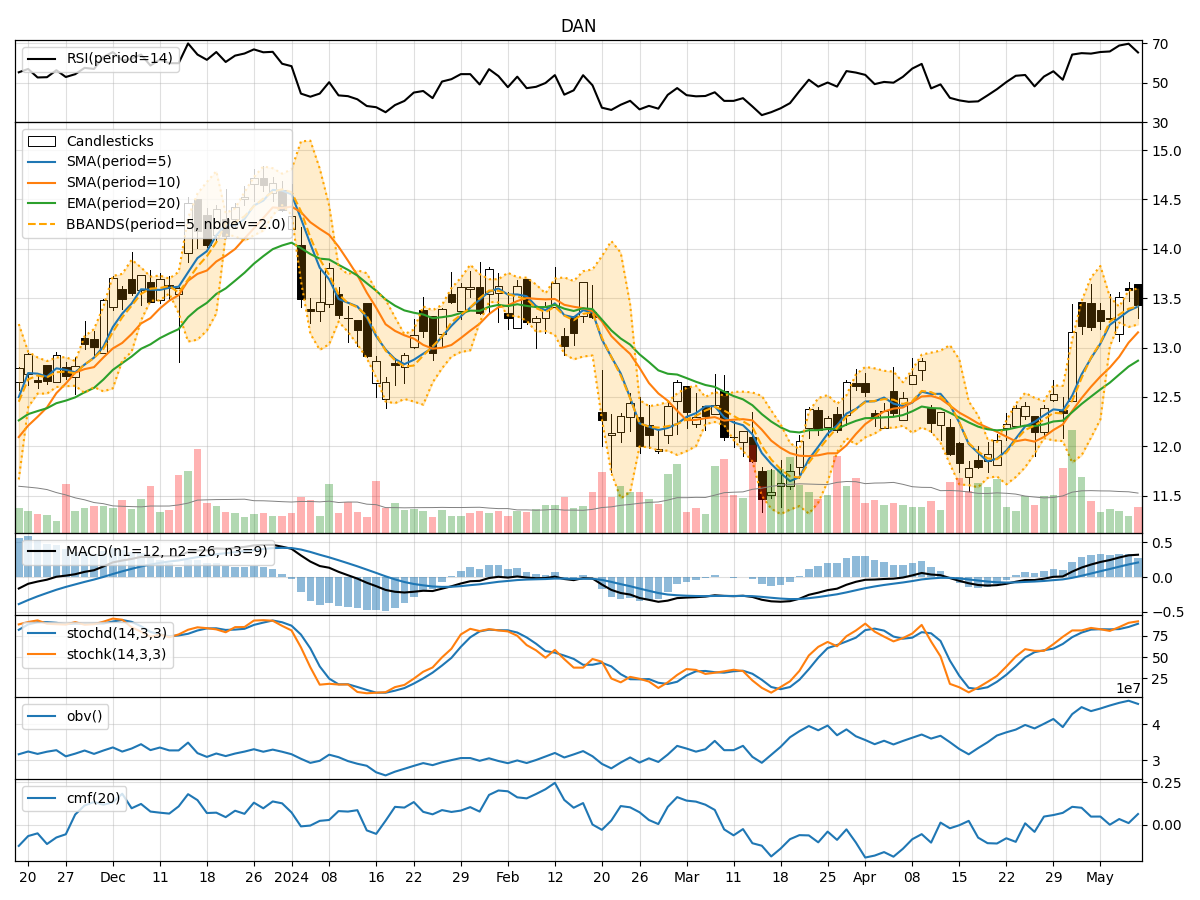
- Moving Averages (MA): The 5-day MA has been fluctuating around the 13.8-13.9 range, indicating a relatively stable trend.
- MACD: The MACD line has been positive, suggesting bullish momentum in the short term.
- EMA: The EMA has been gradually increasing, reflecting a positive trend in the stock price.
Key Observation: The trend indicators point towards a bullish sentiment in the short term.
Momentum Indicators:
- RSI: The RSI has been oscillating around 60-65, indicating moderate momentum.
- Stochastic Oscillator: Both %K and %D have been fluctuating, showing indecision in momentum.
- Williams %R: The Williams %R has been hovering around oversold levels, suggesting a potential reversal.
Key Observation: Momentum indicators suggest a neutral to slightly bearish outlook in the short term.
Volatility Indicators:
- Bollinger Bands: The stock price has been trading within the Bollinger Bands, indicating normal volatility.
- Bollinger %B: The %B has been fluctuating around 0.6-0.7, suggesting moderate volatility.
Key Observation: Volatility indicators imply a stable price movement with no extreme fluctuations.
Volume Indicators:
- On-Balance Volume (OBV): The OBV has shown a slight increase, indicating some buying pressure.
- Chaikin Money Flow (CMF): The CMF has been fluctuating around 0, signaling a balance between buying and selling pressure.
Key Observation: Volume indicators suggest a neutral sentiment with no clear dominance of buying or selling pressure.
Conclusion:
Based on the analysis of the technical indicators, the overall outlook for DAN in the next few days is mixed. While trend indicators point towards a bullish sentiment, momentum indicators suggest a neutral to slightly bearish outlook. Volatility indicators indicate stable price movement, and volume indicators show a neutral sentiment.
Therefore, the next few days for DAN could see a mix of bullish and bearish movements with stable volatility. Traders should exercise caution and closely monitor key levels for potential entry or exit points.