Technical Analysis of CYD 2024-05-10
Overview:
In analyzing the technical indicators for CYD over the last 5 days, we will delve into the trend, momentum, volatility, and volume indicators to provide a comprehensive outlook on the possible stock price movement in the coming days. By examining these key aspects, we aim to offer valuable insights and recommendations for potential investors.
Trend Analysis:
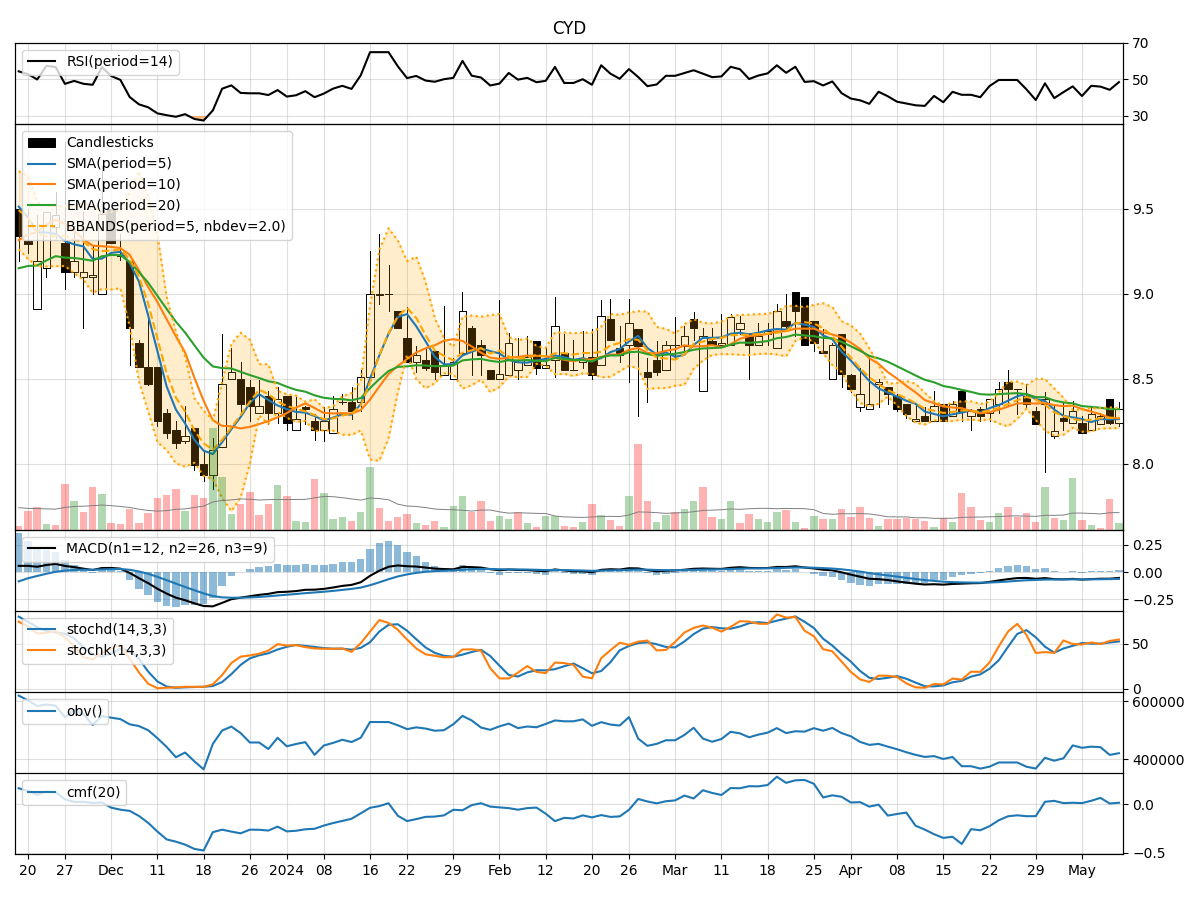
- Moving Averages (MA): The 5-day MA has been hovering around the current stock price, indicating a neutral trend.
- MACD: The MACD line has been consistently below the signal line, suggesting a bearish momentum in the short term.
- EMA: The EMA has been gradually declining, reflecting a weakening trend.
Key Observation: The trend indicators point towards a bearish sentiment in the short term.
Momentum Analysis:
- RSI: The RSI has been fluctuating within the neutral zone, indicating indecision among traders.
- Stochastic Oscillator: Both %K and %D have been oscillating near the overbought territory, signaling a potential reversal.
- Williams %R: The indicator has been moving towards the oversold region, hinting at a possible buying opportunity.
Key Observation: Momentum indicators suggest a mixed sentiment with a slight bullish bias emerging.
Volatility Analysis:
- Bollinger Bands (BB): The bands have been narrowing, indicating decreasing volatility.
- Bollinger %B: The %B value has been fluctuating within a tight range, reflecting consolidation.
- Bollinger Band Width: The band width has been contracting, signaling a potential breakout or breakdown.
Key Observation: Volatility indicators point towards a consolidation phase with a potential for a breakout.
Volume Analysis:
- On-Balance Volume (OBV): The OBV has been declining, suggesting selling pressure in the stock.
- Chaikin Money Flow (CMF): The CMF has been relatively stable, indicating a balance between buying and selling pressure.
Key Observation: Volume indicators indicate a bearish sentiment prevailing in the market.
Conclusion:
Based on the analysis of trend, momentum, volatility, and volume indicators, the overall outlook for CYD in the next few days leans towards a bearish sentiment. While momentum indicators show a slight bullish bias, the trend and volume indicators suggest a bearish outlook. The consolidation phase indicated by volatility indicators could lead to a breakout, potentially on the downside.
Therefore, the possible stock price movement for CYD in the next few days is likely to be on a downward trajectory. Investors should exercise caution and consider waiting for a clearer signal before making any trading decisions.