Technical Analysis of CTRA 2024-05-10
Overview:
In analyzing the technical indicators for CTRA over the last 5 days, we will delve into the trend, momentum, volatility, and volume indicators to provide a comprehensive outlook on the possible stock price movement in the coming days. By examining these key aspects, we aim to offer valuable insights and recommendations for potential investors.
Trend Indicators:
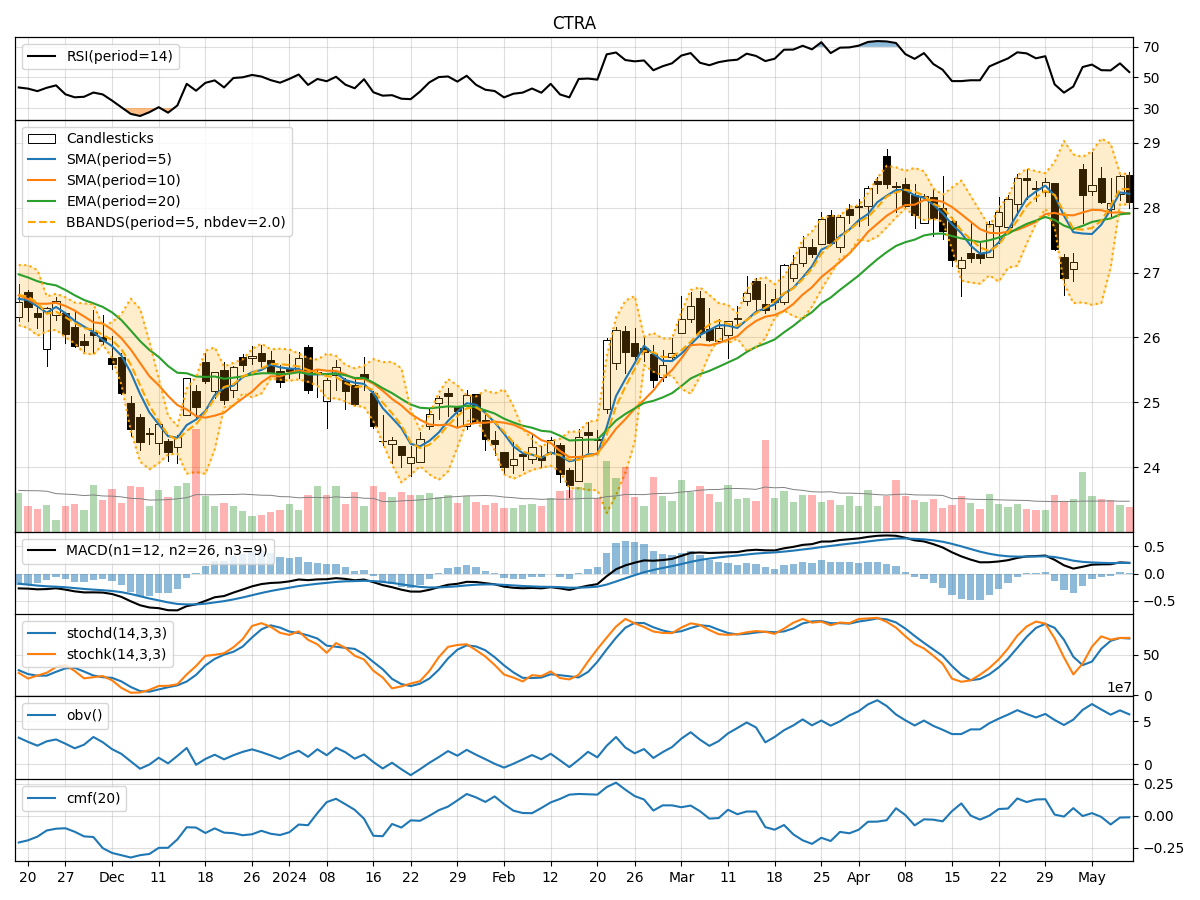
- Moving Averages (MA): The 5-day MA has been relatively stable, indicating a consistent trend in the stock price.
- MACD: The MACD line has shown slight fluctuations but has generally remained close to the signal line, suggesting a balanced momentum.
- EMA: The EMA has been gradually increasing, reflecting a positive trend in the stock price.
Momentum Indicators:
- RSI: The RSI has been fluctuating around the neutral level of 50, indicating a lack of strong momentum in either direction.
- Stochastic Oscillator: Both %K and %D have been hovering around the overbought territory, suggesting a potential reversal in the short term.
- Williams %R: The Williams %R has been oscillating in the oversold and overbought zones, signaling indecision among traders.
Volatility Indicators:
- Bollinger Bands: The narrowing of the Bollinger Bands indicates decreasing volatility and a potential period of consolidation.
- Bollinger %B: The %B indicator has been fluctuating within a narrow range, further supporting the consolidation phase.
- Average True Range (ATR): The ATR has shown a decline, indicating reduced price volatility.
Volume Indicators:
- On-Balance Volume (OBV): The OBV has been relatively flat, suggesting a balance between buying and selling pressure.
- Chaikin Money Flow (CMF): The CMF has been negative, indicating a slight outflow of money from the stock.
Key Observations and Opinions:
- Trend: The stock is exhibiting a stable trend with a slight bullish bias based on the moving averages and EMA.
- Momentum: Momentum indicators suggest a lack of strong directional momentum, with potential for a short-term reversal.
- Volatility: Volatility is decreasing, pointing towards a period of consolidation and potential price stability.
- Volume: The volume indicators reflect a balanced market sentiment with no clear dominance from buyers or sellers.
Conclusion:
Based on the analysis of the technical indicators, the stock price of CTRA is likely to experience sideways movement in the coming days. The lack of strong momentum, decreasing volatility, and balanced volume suggest a period of consolidation. Traders may expect the stock to trade within a narrow range without significant price fluctuations. It is advisable to closely monitor key support and resistance levels for potential breakout opportunities.