Technical Analysis of CTLT 2024-05-10
Overview:
In analyzing the technical indicators for CTLT over the last 5 days, we will delve into the trend, momentum, volatility, and volume indicators to provide a comprehensive outlook on the possible stock price movement. By examining these key indicators, we aim to offer valuable insights and predictions for the upcoming days.
Trend Analysis:
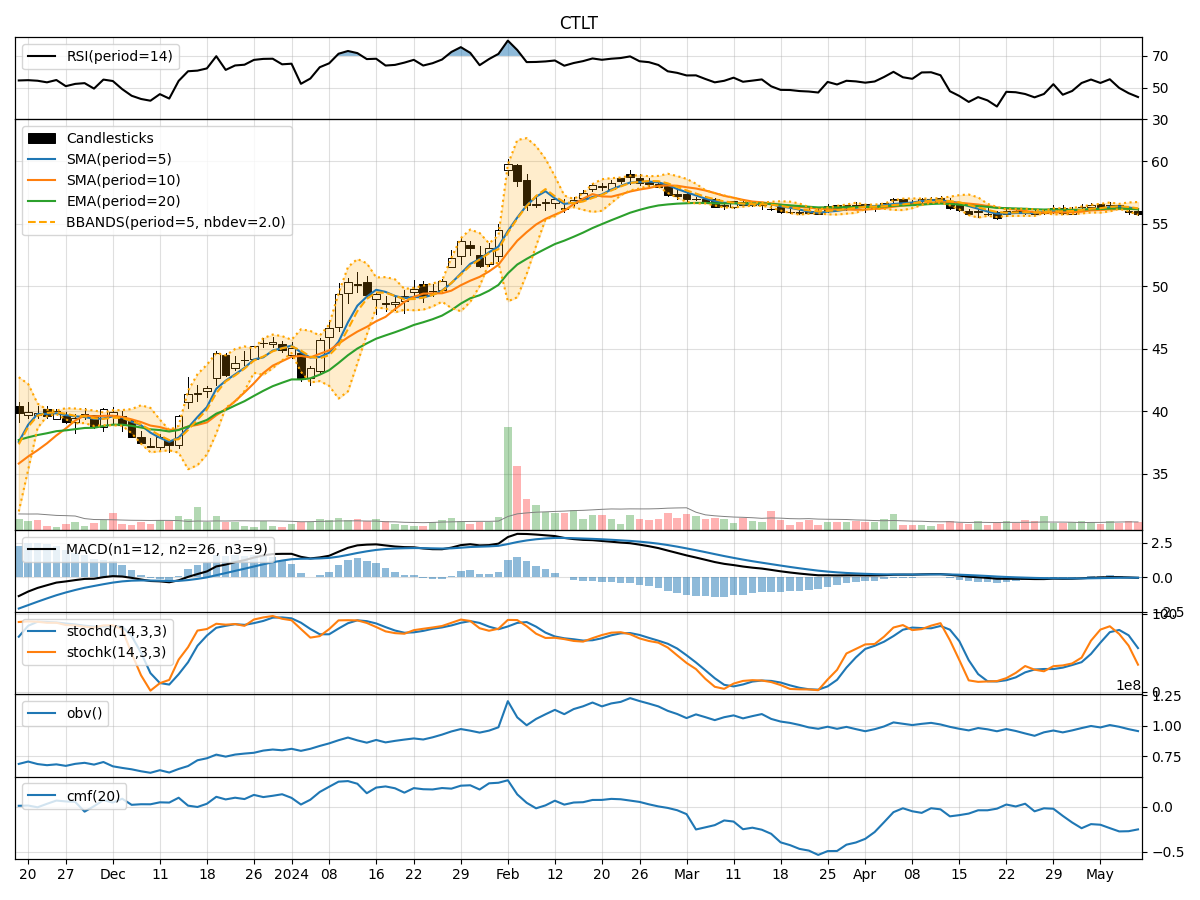
- Moving Averages (MA): The 5-day Moving Average (MA) has been fluctuating around the closing prices, indicating short-term price trends. The Simple Moving Average (SMA) and Exponential Moving Average (EMA) have shown slight variations but have generally been close to each other.
- MACD: The Moving Average Convergence Divergence (MACD) has been negative, suggesting a bearish momentum in the short term. The MACD Histogram (MACDH) has been positive but decreasing, indicating a potential reversal in the bearish trend.
Momentum Analysis:
- RSI: The Relative Strength Index (RSI) has been declining, moving towards the oversold territory, indicating a weakening momentum.
- Stochastic Oscillator: Both %K and %D have been decreasing, with %K approaching the oversold region, signaling a potential reversal or consolidation.
- Williams %R: The Williams %R has been consistently in the oversold territory, indicating a bearish sentiment.
Volatility Analysis:
- Bollinger Bands (BB): The Bollinger Bands have been narrowing, suggesting decreasing volatility in the stock price. The bands are relatively close to each other, indicating a potential breakout or significant price movement.
- Bollinger %B: The %B indicator has been fluctuating around 0.5, indicating a balanced state between upper and lower bands.
Volume Analysis:
- On-Balance Volume (OBV): The OBV has been negative, indicating a net selling pressure in the stock. The declining OBV suggests a bearish sentiment among investors.
- Chaikin Money Flow (CMF): The CMF has been consistently negative, indicating outflow of money from the stock. The negative CMF reflects a bearish outlook on the stock.
Conclusion:
Based on the analysis of the technical indicators, the stock of CTLT is currently in a bearish phase. The trend indicators show a potential reversal in the bearish trend, while the momentum indicators suggest a weakening momentum with oversold conditions. The volatility indicators point towards a potential breakout or significant price movement, while the volume indicators indicate a bearish sentiment among investors.
Forecast:
Considering the overall bearish outlook and the potential reversal signals in the trend indicators, it is likely that the stock price of CTLT may experience further downward movement in the next few days. Traders and investors should exercise caution and consider risk management strategies in their trading decisions.