Technical Analysis of CPT 2024-05-10
Overview:
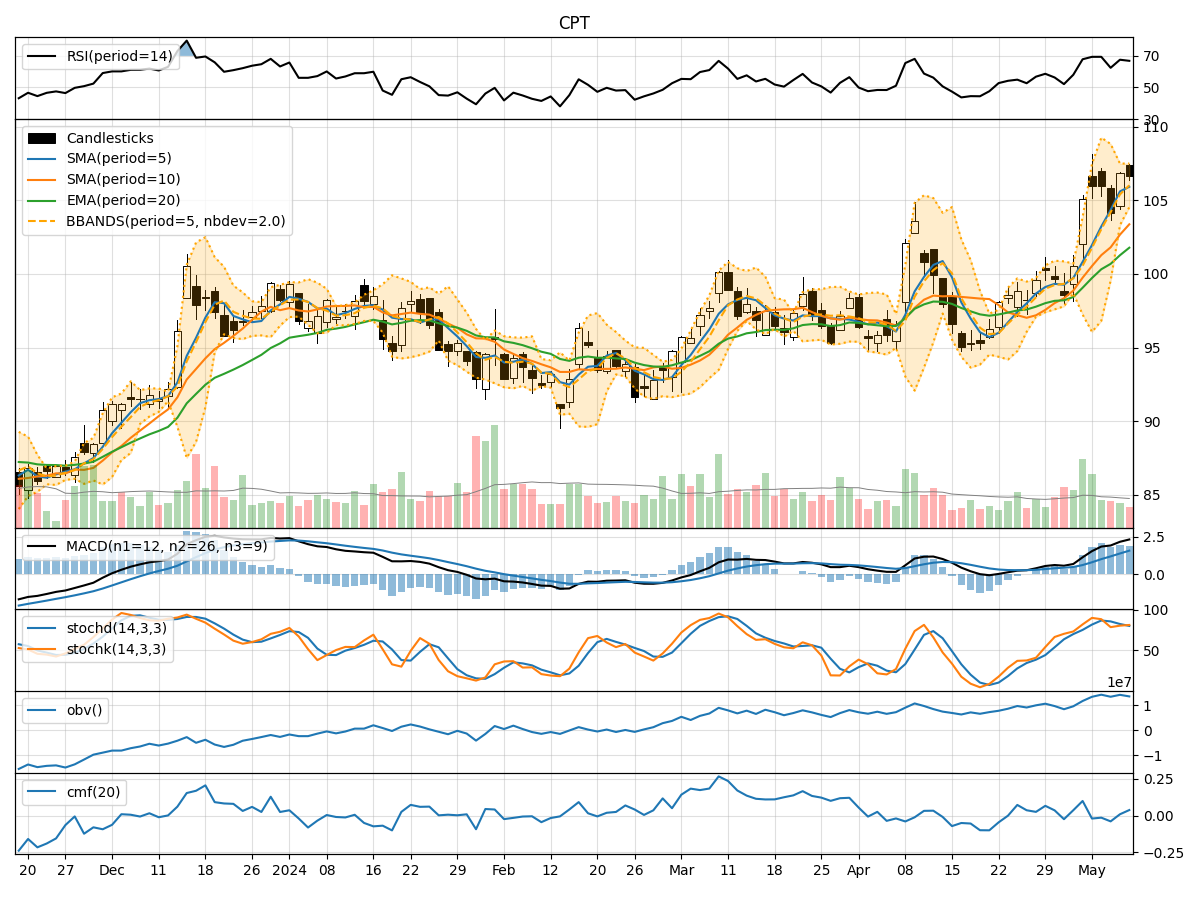
In analyzing the technical indicators for CPT stock over the last 5 days, we will delve into the trend, momentum, volatility, and volume indicators to provide a comprehensive outlook on the possible stock price movement in the coming days. By examining key metrics such as moving averages, MACD, RSI, Bollinger Bands, and OBV, we aim to offer valuable insights and predictions for potential price action.
Trend Analysis:
- Moving Averages (MA): The 5-day MA has been consistently above the closing prices, indicating a bullish trend.
- MACD: The MACD line has been above the signal line, suggesting a bullish momentum.
- EMA: The EMA has been trending upwards, supporting the bullish sentiment.
Momentum Analysis:
- RSI: The RSI has been fluctuating around 60-70, indicating moderate momentum.
- Stochastic Oscillator: Both %K and %D have been in the overbought zone, signaling a potential reversal.
- Williams %R: The indicator has been hovering around oversold levels, suggesting a possible buying opportunity.
Volatility Analysis:
- Bollinger Bands: The stock price has mostly stayed within the bands, showing moderate volatility.
- Bollinger %B: The %B indicator has been fluctuating around the midline, indicating a balanced market sentiment.
Volume Analysis:
- On-Balance Volume (OBV): The OBV has shown mixed signals, reflecting indecision among investors.
- Chaikin Money Flow (CMF): The CMF has been negative, indicating selling pressure in the market.
Key Observations:
- The trend indicators suggest a bullish bias in the short term.
- Momentum indicators show a mixed picture with potential for a reversal.
- Volatility remains moderate, with no extreme price movements expected.
- Volume indicators indicate a lack of strong buying interest.
Conclusion:
Based on the analysis of the technical indicators, the next few days for CPT stock could see further upside potential in the price movement. However, caution is advised as momentum indicators hint at a possible reversal, and volume indicators show a lack of strong buying support. Traders should closely monitor key levels and wait for confirmation before taking significant positions. Overall, the outlook leans towards a cautiously bullish view for the upcoming days.