Technical Analysis of CPAC 2024-05-10
Overview:
In analyzing the technical indicators for CPAC over the last 5 days, we will delve into the trend, momentum, volatility, and volume indicators to provide a comprehensive outlook on the possible stock price movement. By examining these key aspects, we aim to offer valuable insights and predictions for the upcoming days.
Trend Analysis:
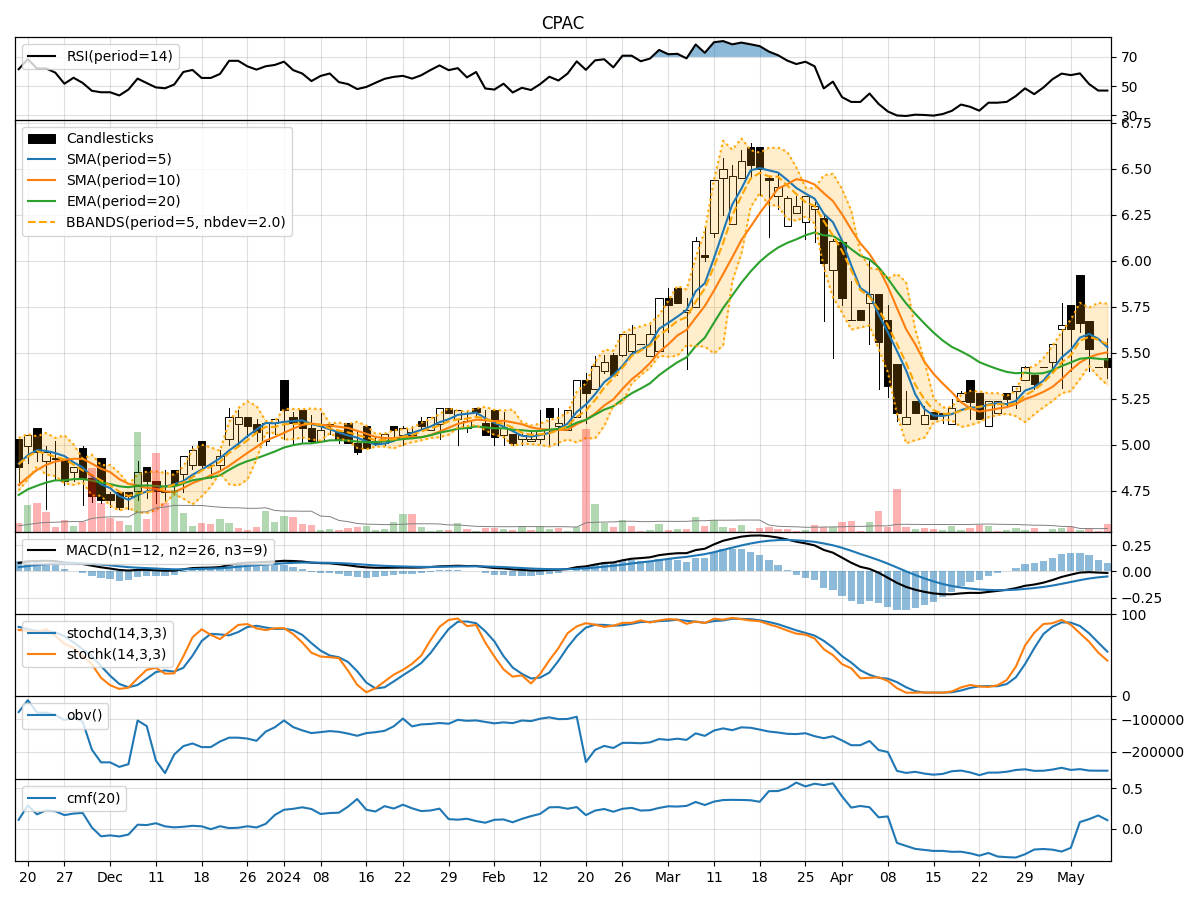
- Moving Averages (MA): The 5-day Moving Average (MA) has been fluctuating around the closing prices, indicating short-term price trends. The Simple Moving Average (SMA) and Exponential Moving Average (EMA) show a slight upward trend, suggesting potential bullish momentum.
- MACD: The Moving Average Convergence Divergence (MACD) has been positive, with the MACD line consistently above the signal line. This signals a bullish trend in the stock price.
- Momentum: The MACD Histogram has been positive, indicating increasing bullish momentum in the stock.
Momentum Analysis:
- RSI: The Relative Strength Index (RSI) has been fluctuating around the 50 level, suggesting a neutral stance in momentum.
- Stochastic Oscillator: The Stochastic Oscillator shows a downward trend, moving towards oversold conditions. This indicates a potential reversal in momentum to the upside.
- Williams %R: The Williams %R indicator is in oversold territory, signaling a possible buying opportunity.
Volatility Analysis:
- Bollinger Bands: The Bollinger Bands are narrowing, indicating decreasing volatility in the stock price. This could precede a period of consolidation or a breakout in either direction.
- Bollinger %B: The %B indicator is hovering around the middle range, suggesting a balanced market sentiment.
Volume Analysis:
- On-Balance Volume (OBV): The OBV has been fluctuating, indicating mixed buying and selling pressure in the stock.
- Chaikin Money Flow (CMF): The CMF has been positive, suggesting inflows into the stock over the past 20 days.
Conclusion:
Based on the analysis of the technical indicators, the stock price of CPAC is likely to experience sideways movement in the next few days. The trend indicators point towards a potential bullish bias, supported by the positive MACD and moving averages. However, the momentum indicators suggest a neutral to slightly bullish stance, with the Stochastic Oscillator hinting at a possible reversal to the upside.
The volatility indicators indicate a decreasing volatility, which could lead to a period of consolidation before a potential breakout. The volume indicators show mixed signals, reflecting a balanced buying and selling pressure.
In conclusion, while there are indications of a bullish bias in the short term, the overall outlook suggests a sideways movement with a potential for upward momentum in the stock price of CPAC. Investors should closely monitor key levels and wait for confirmation of a clear trend before making trading decisions.