Technical Analysis of CNHI 2024-05-10
Overview:
In analyzing the technical indicators for CNHI over the last 5 days, we will delve into the trend, momentum, volatility, and volume indicators to provide a comprehensive outlook on the possible stock price movement. By examining these key indicators, we aim to offer insights into the potential direction of CNHI's stock price in the coming days.
Trend Analysis:
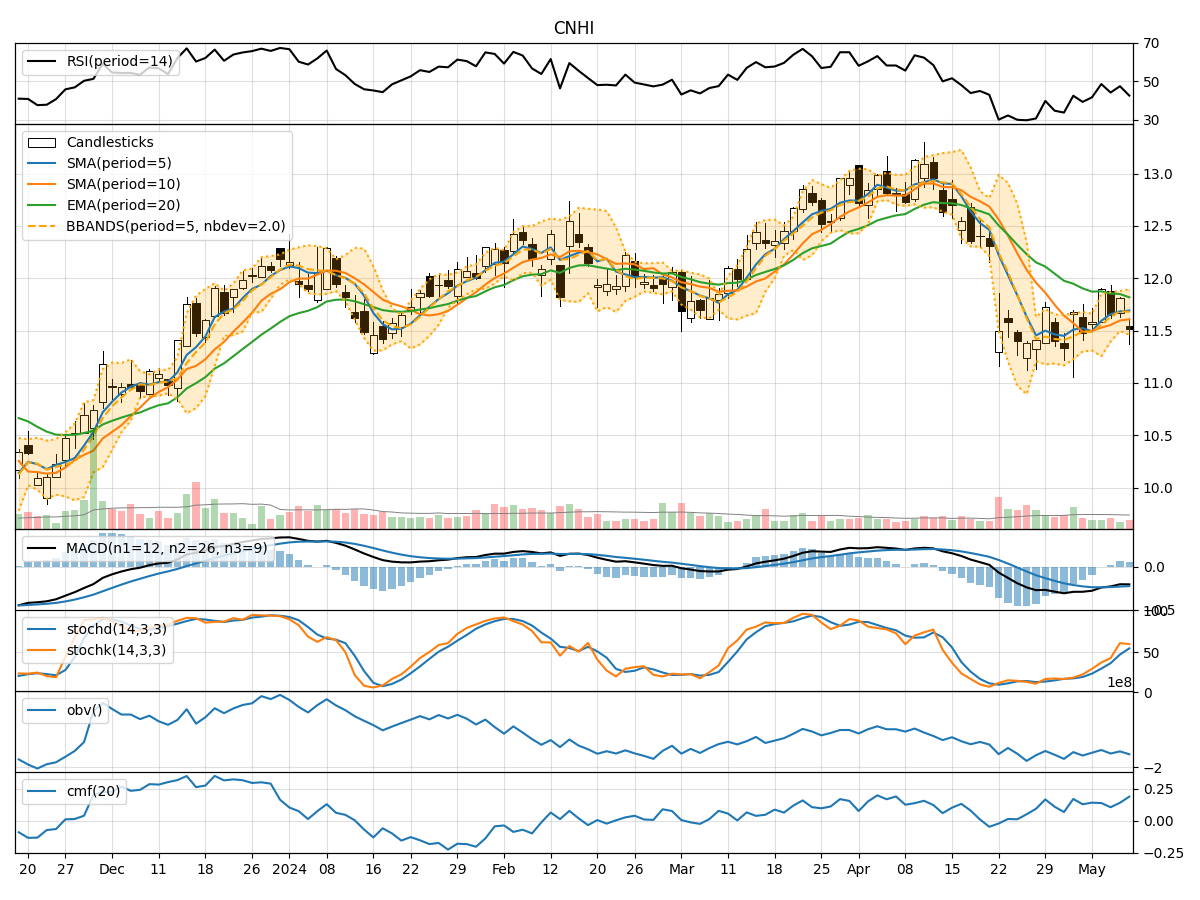
- Moving Averages (MA): The 5-day Moving Average (MA) has been fluctuating around the closing prices, indicating short-term price trends. The Simple Moving Average (SMA) and Exponential Moving Average (EMA) show a slight downward trend, with the EMA lagging behind.
- MACD: The Moving Average Convergence Divergence (MACD) and its signal line (MACDH) have been negative, suggesting a bearish momentum in the short term.
Momentum Analysis:
- RSI: The Relative Strength Index (RSI) has been hovering around the mid-range, indicating a neutral momentum with no clear overbought or oversold conditions.
- Stochastic Oscillator: Both %K and %D lines of the Stochastic Oscillator have been rising, showing increasing buying pressure and potential for further upward movement.
- Williams %R: The Williams %R is close to the oversold territory, suggesting a possible reversal in the short term.
Volatility Analysis:
- Bollinger Bands (BB): The Bollinger Bands have been relatively narrow, indicating low volatility in the stock price. The bands are not expanding significantly, suggesting a lack of strong price movements.
- Bollinger %B: The %B indicator is below 1, indicating that the stock price is trading below the lower Bollinger Band, potentially signaling an oversold condition.
Volume Analysis:
- On-Balance Volume (OBV): The OBV has been fluctuating, indicating mixed buying and selling pressure in the stock.
- Chaikin Money Flow (CMF): The CMF has been positive, suggesting that money is flowing into the stock over the 20-day period.
Conclusion:
Based on the analysis of the technical indicators, the next few days for CNHI could see sideways movement with a slight upward bias. The momentum indicators suggest a potential for a short-term rebound, supported by the rising Stochastic %K and %D lines. However, the trend indicators, particularly the MACD, signal a bearish sentiment in the near term.
Considering the low volatility and mixed volume signals, it is likely that CNHI will experience consolidation in the coming days. Traders may observe for a breakout above the moving averages and a confirmation of bullish momentum before considering long positions. It is essential to monitor key support and resistance levels for potential entry and exit points.
In conclusion, while there may be some short-term upside potential, the overall outlook for CNHI remains neutral with a cautious stance recommended for traders and investors.