Technical Analysis of CNF 2024-05-10
Overview:
In analyzing the technical indicators for CNF over the last 5 days, we will delve into the trend, momentum, volatility, and volume indicators to provide a comprehensive outlook on the possible stock price movement in the coming days. By examining these key aspects, we aim to offer valuable insights and recommendations for potential investors.
Trend Analysis:
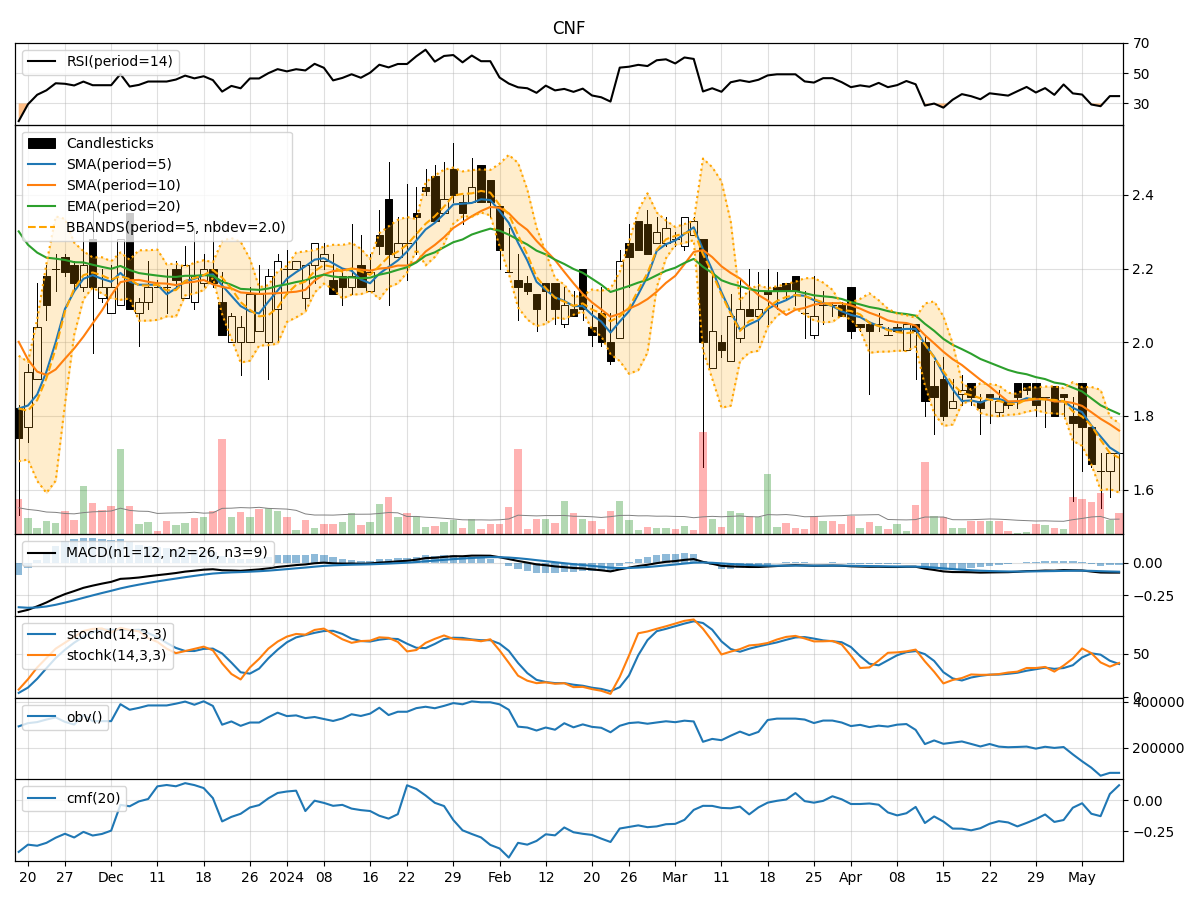
- Moving Averages (MA): The 5-day MA has been consistently below the closing prices, indicating a downward trend.
- MACD: The MACD line has been negative, with the MACD histogram showing a decreasing trend, signaling bearish momentum.
Momentum Analysis:
- RSI: The RSI values have been relatively low, suggesting a lack of strong momentum in either direction.
- Stochastic Oscillator: Both %K and %D values have been declining, indicating weakening momentum.
Volatility Analysis:
- Bollinger Bands (BB): The stock price has been trading below the middle Bollinger Band, indicating a bearish trend.
Volume Analysis:
- On-Balance Volume (OBV): The OBV values have been negative, reflecting selling pressure in the market.
- Chaikin Money Flow (CMF): The CMF values have been consistently negative, indicating a lack of buying interest.
Key Observations:
- The trend indicators, momentum oscillators, and volume indicators all point towards a bearish sentiment in the market.
- The stock is currently in a downtrend, as indicated by the moving averages and MACD.
- The lack of strong momentum and negative volume indicators suggest that the stock may continue to face selling pressure in the near term.
Conclusion:
Based on the analysis of the technical indicators, the next few days' possible stock price movement for CNF is likely to be downward. Investors should exercise caution and consider waiting for more positive signals before considering any long positions. The overall market sentiment is currently bearish, and it is advisable to closely monitor the price action for any potential reversal signals before making any investment decisions.