Technical Analysis of CNDA 2024-05-31
Overview:
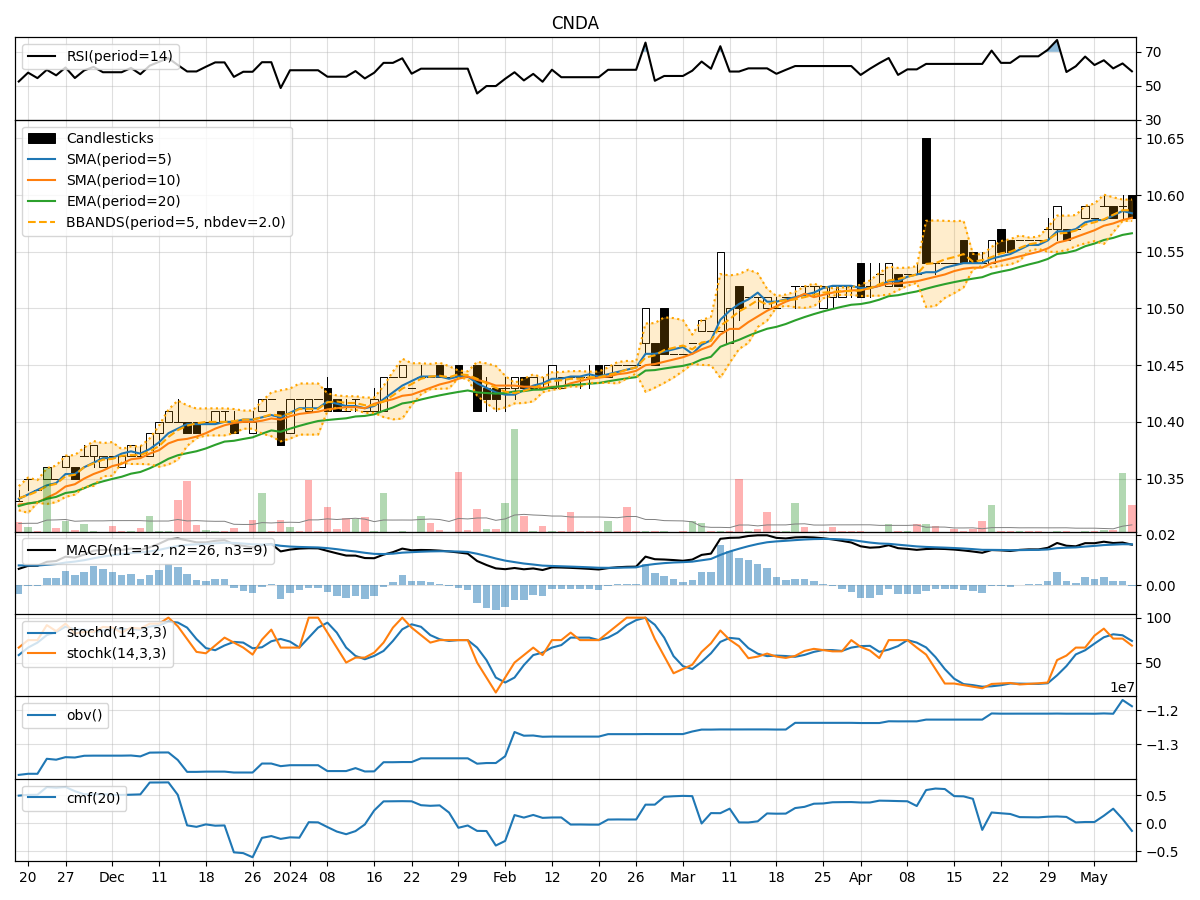
In analyzing the technical indicators for CNDA over the last 5 days, we will delve into the trend, momentum, volatility, and volume indicators to provide a comprehensive outlook on the possible stock price movement in the coming days. By examining these key indicators, we aim to offer valuable insights and predictions for potential investors.
Trend Indicators:
- Moving Averages (MA): The 5-day MA has been relatively stable around the closing price, indicating a neutral trend.
- MACD: The MACD line has been consistently positive, suggesting a bullish momentum.
- RSI: The RSI has been fluctuating around the 50 level, indicating a balanced market sentiment.
Momentum Indicators:
- Stochastic Oscillator: Both %K and %D have been declining, signaling a potential bearish momentum.
- Williams %R: The indicator has been hovering in the oversold territory, indicating a potential reversal.
Volatility Indicators:
- Bollinger Bands: The bands have been narrowing, suggesting decreasing volatility.
- BB% (Bollinger Band %B): The %B has been fluctuating around the midline, indicating a neutral stance.
Volume Indicators:
- On-Balance Volume (OBV): The OBV has been relatively flat, indicating a balance between buying and selling pressure.
- Chaikin Money Flow (CMF): The CMF has been positive but stable, suggesting a neutral volume flow.
Key Observations:
- The trend indicators show a neutral stance with a slight bullish bias from the MACD.
- Momentum indicators point towards a potential bearish momentum shift.
- Volatility indicators suggest decreasing price fluctuations.
- Volume indicators indicate a balanced volume flow with no significant accumulation or distribution.
Conclusion:
Based on the analysis of the technical indicators, the next few days for CNDA could see a sideways movement with a slight bearish bias. Traders should exercise caution as the momentum indicators hint at a potential shift in sentiment towards the downside. It is advisable to closely monitor key support levels and wait for clearer signals before making any significant trading decisions.