Technical Analysis of CMI 2024-05-10
Overview:
In analyzing the technical indicators for CMI over the last 5 days, we will delve into the trend, momentum, volatility, and volume indicators to provide a comprehensive outlook on the possible stock price movement in the coming days.
Trend Analysis:
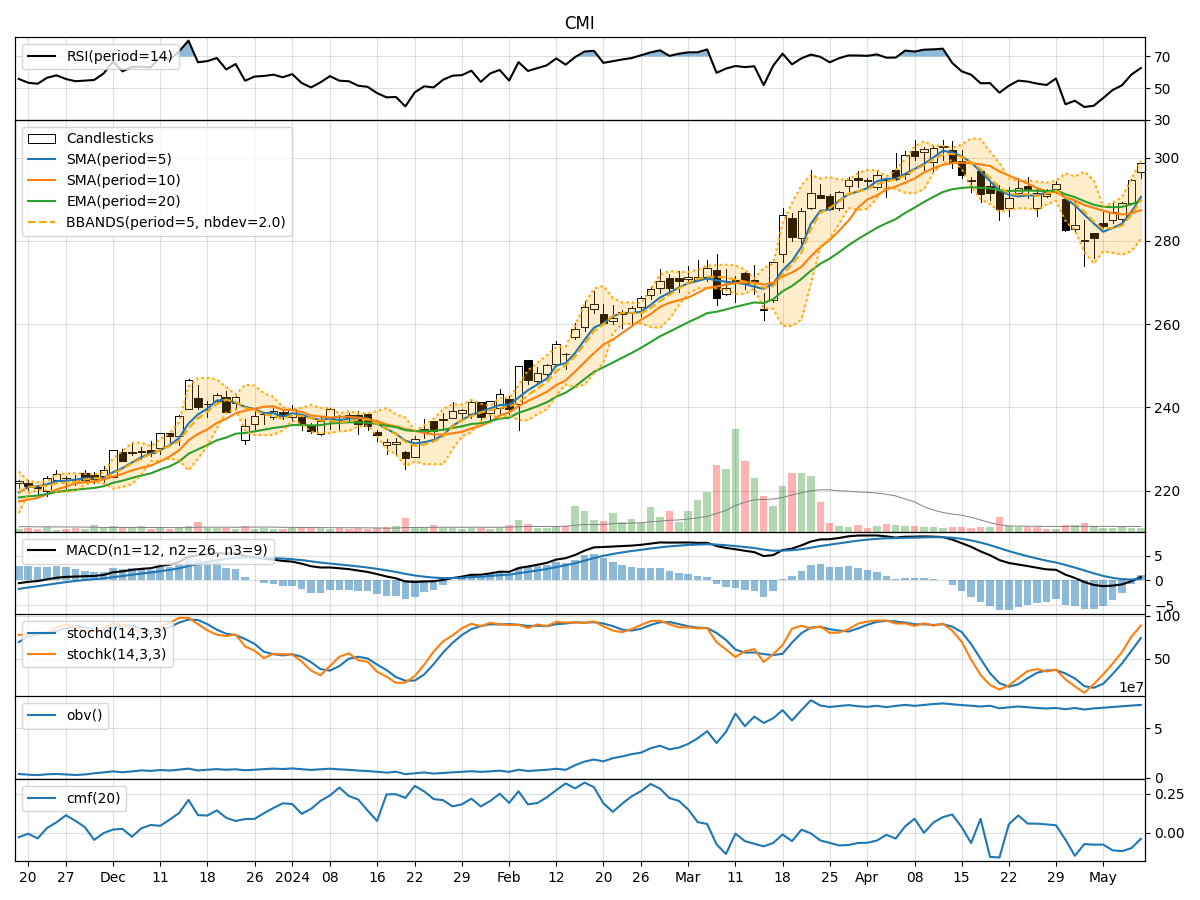
- Moving Averages (MA): The 5-day Moving Average (MA) has been trending upwards, indicating a positive momentum in the stock price.
- MACD: The Moving Average Convergence Divergence (MACD) has shown a positive trend with the MACD line consistently above the signal line.
- EMA: The Exponential Moving Average (EMA) has been on an upward trajectory, suggesting a bullish sentiment in the market.
Key Observation: The trend indicators point towards a bullish outlook for CMI.
Momentum Analysis:
- RSI: The Relative Strength Index (RSI) has been increasing, indicating strengthening momentum in the stock.
- Stochastic Oscillator: Both %K and %D have been rising, signaling increasing buying pressure.
- Williams %R: The Williams %R is moving towards the oversold region, suggesting a potential reversal in the stock price.
Key Observation: The momentum indicators support a bullish sentiment for CMI.
Volatility Analysis:
- Bollinger Bands: The Bollinger Bands have been widening, indicating increased volatility in the stock price.
- Bollinger %B: The %B indicator is hovering around 0.9, suggesting the stock is trading near the upper band.
Key Observation: The volatility indicators suggest a high volatility environment for CMI.
Volume Analysis:
- On-Balance Volume (OBV): The OBV has been steadily increasing, reflecting strong buying interest in the stock.
- Chaikin Money Flow (CMF): The CMF has been negative but improving, indicating a potential influx of money into the stock.
Key Observation: The volume indicators point towards accumulation in CMI.
Conclusion:
Based on the analysis of the technical indicators, the overall outlook for CMI in the next few days is bullish. The trend and momentum indicators suggest a continued upward movement in the stock price, supported by increasing buying pressure and positive trend signals. However, the high volatility in the stock price should be noted, and investors should exercise caution. Considering the accumulation in volume, there is a strong possibility of further upside potential in CMI's stock price.
In conclusion, investors may consider buying or holding positions in CMI based on the current technical analysis.