Technical Analysis of CMG 2024-05-10
Overview:
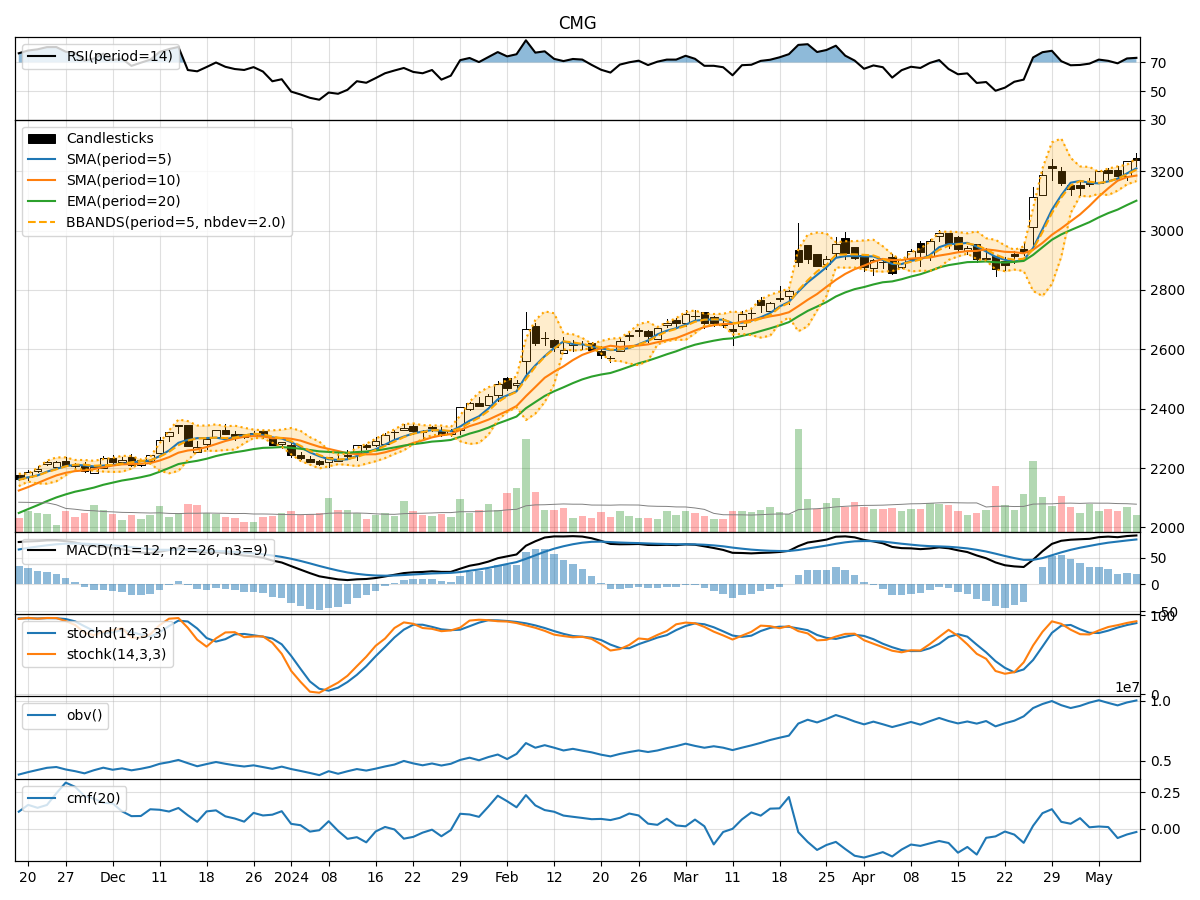
In analyzing the technical indicators for Chipotle Mexican Grill (CMG) over the last 5 days, we will delve into the trend, momentum, volatility, and volume indicators to provide a comprehensive outlook on the possible stock price movement in the coming days.
Trend Analysis:
- Moving Averages (MA): The 5-day Moving Average (MA) has been consistently rising, indicating a bullish trend in the short term.
- MACD: The MACD line has been increasing, showing bullish momentum.
- EMA: The Exponential Moving Average (EMA) has also been on an upward trajectory, supporting the bullish trend.
Key Observation: The trend indicators suggest a strong bullish sentiment in the stock price movement.
Momentum Analysis:
- RSI: The Relative Strength Index (RSI) has been in the overbought territory, indicating a strong buying momentum.
- Stochastic Oscillator: Both %K and %D have been in the overbought zone, signaling a potential reversal.
- Williams %R: The Williams %R is in the oversold region, suggesting a possible buying opportunity.
Key Observation: Momentum indicators are mixed, with RSI signaling overbought conditions while Williams %R indicates oversold levels.
Volatility Analysis:
- Bollinger Bands: The stock price has been trading within the upper Bollinger Band, indicating high volatility.
- Bollinger Band Width: The Band Width has been fluctuating, suggesting potential price swings.
- Bollinger Band %B: The %B indicator is above 0.8, indicating an overbought condition.
Key Observation: Volatility indicators point towards high price fluctuations and potential reversal.
Volume Analysis:
- On-Balance Volume (OBV): The OBV has shown mixed movements, indicating indecision among investors.
- Chaikin Money Flow (CMF): The CMF has been negative, suggesting outflow of money from the stock.
Key Observation: Volume indicators reflect uncertainty in investor sentiment and potential selling pressure.
Conclusion:
Based on the analysis of the technical indicators, the next few days' possible stock price movement for CMG is likely to experience a correction or consolidation phase. The bullish trend may see a temporary pause or a slight pullback due to overbought conditions in momentum indicators and high volatility levels. Investors should exercise caution and consider potential profit-taking opportunities in the short term.
Recommendation:
- Short-term Traders: Consider booking profits or setting tight stop-loss orders to protect gains.
- Long-term Investors: Monitor the price action closely for potential entry points during the consolidation phase.
Disclaimer:
Remember that technical analysis is not a guaranteed predictor of future price movements, and other fundamental factors can influence stock prices. It is essential to conduct thorough research and consider multiple indicators before making any investment decisions. Consulting with a financial advisor is recommended for personalized investment advice.